Interactive Pivot Charts in JavaScript: From Summary to Source
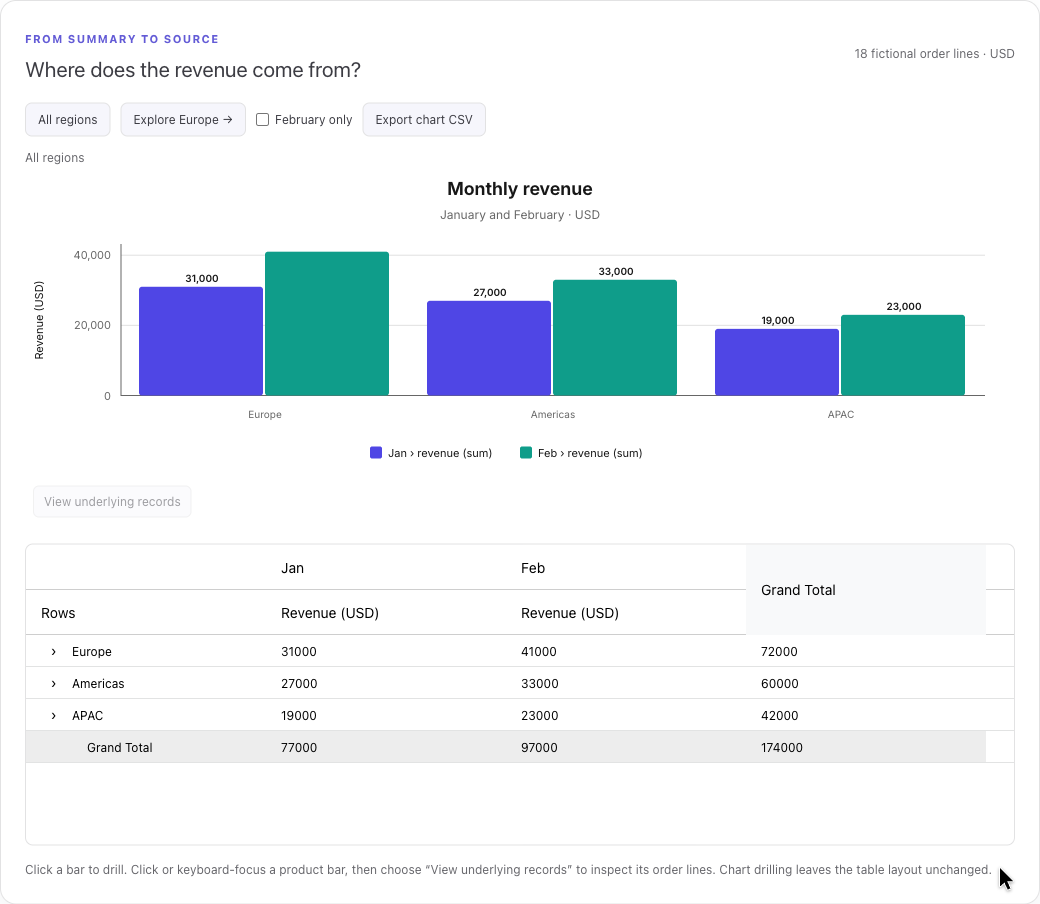
Build interactive JavaScript Pivot Charts with a real sales example. Drill from regions to products, inspect source orders, filter a linked report, and export chart data.
The RevoGrid Blog
Practical tutorials, thoughtful comparisons, and engineering guides
for data grids, analytics, and planning.

Build interactive JavaScript Pivot Charts with a real sales example. Drill from regions to products, inspect source orders, filter a linked report, and export chart data.
Explore the library
35 articles

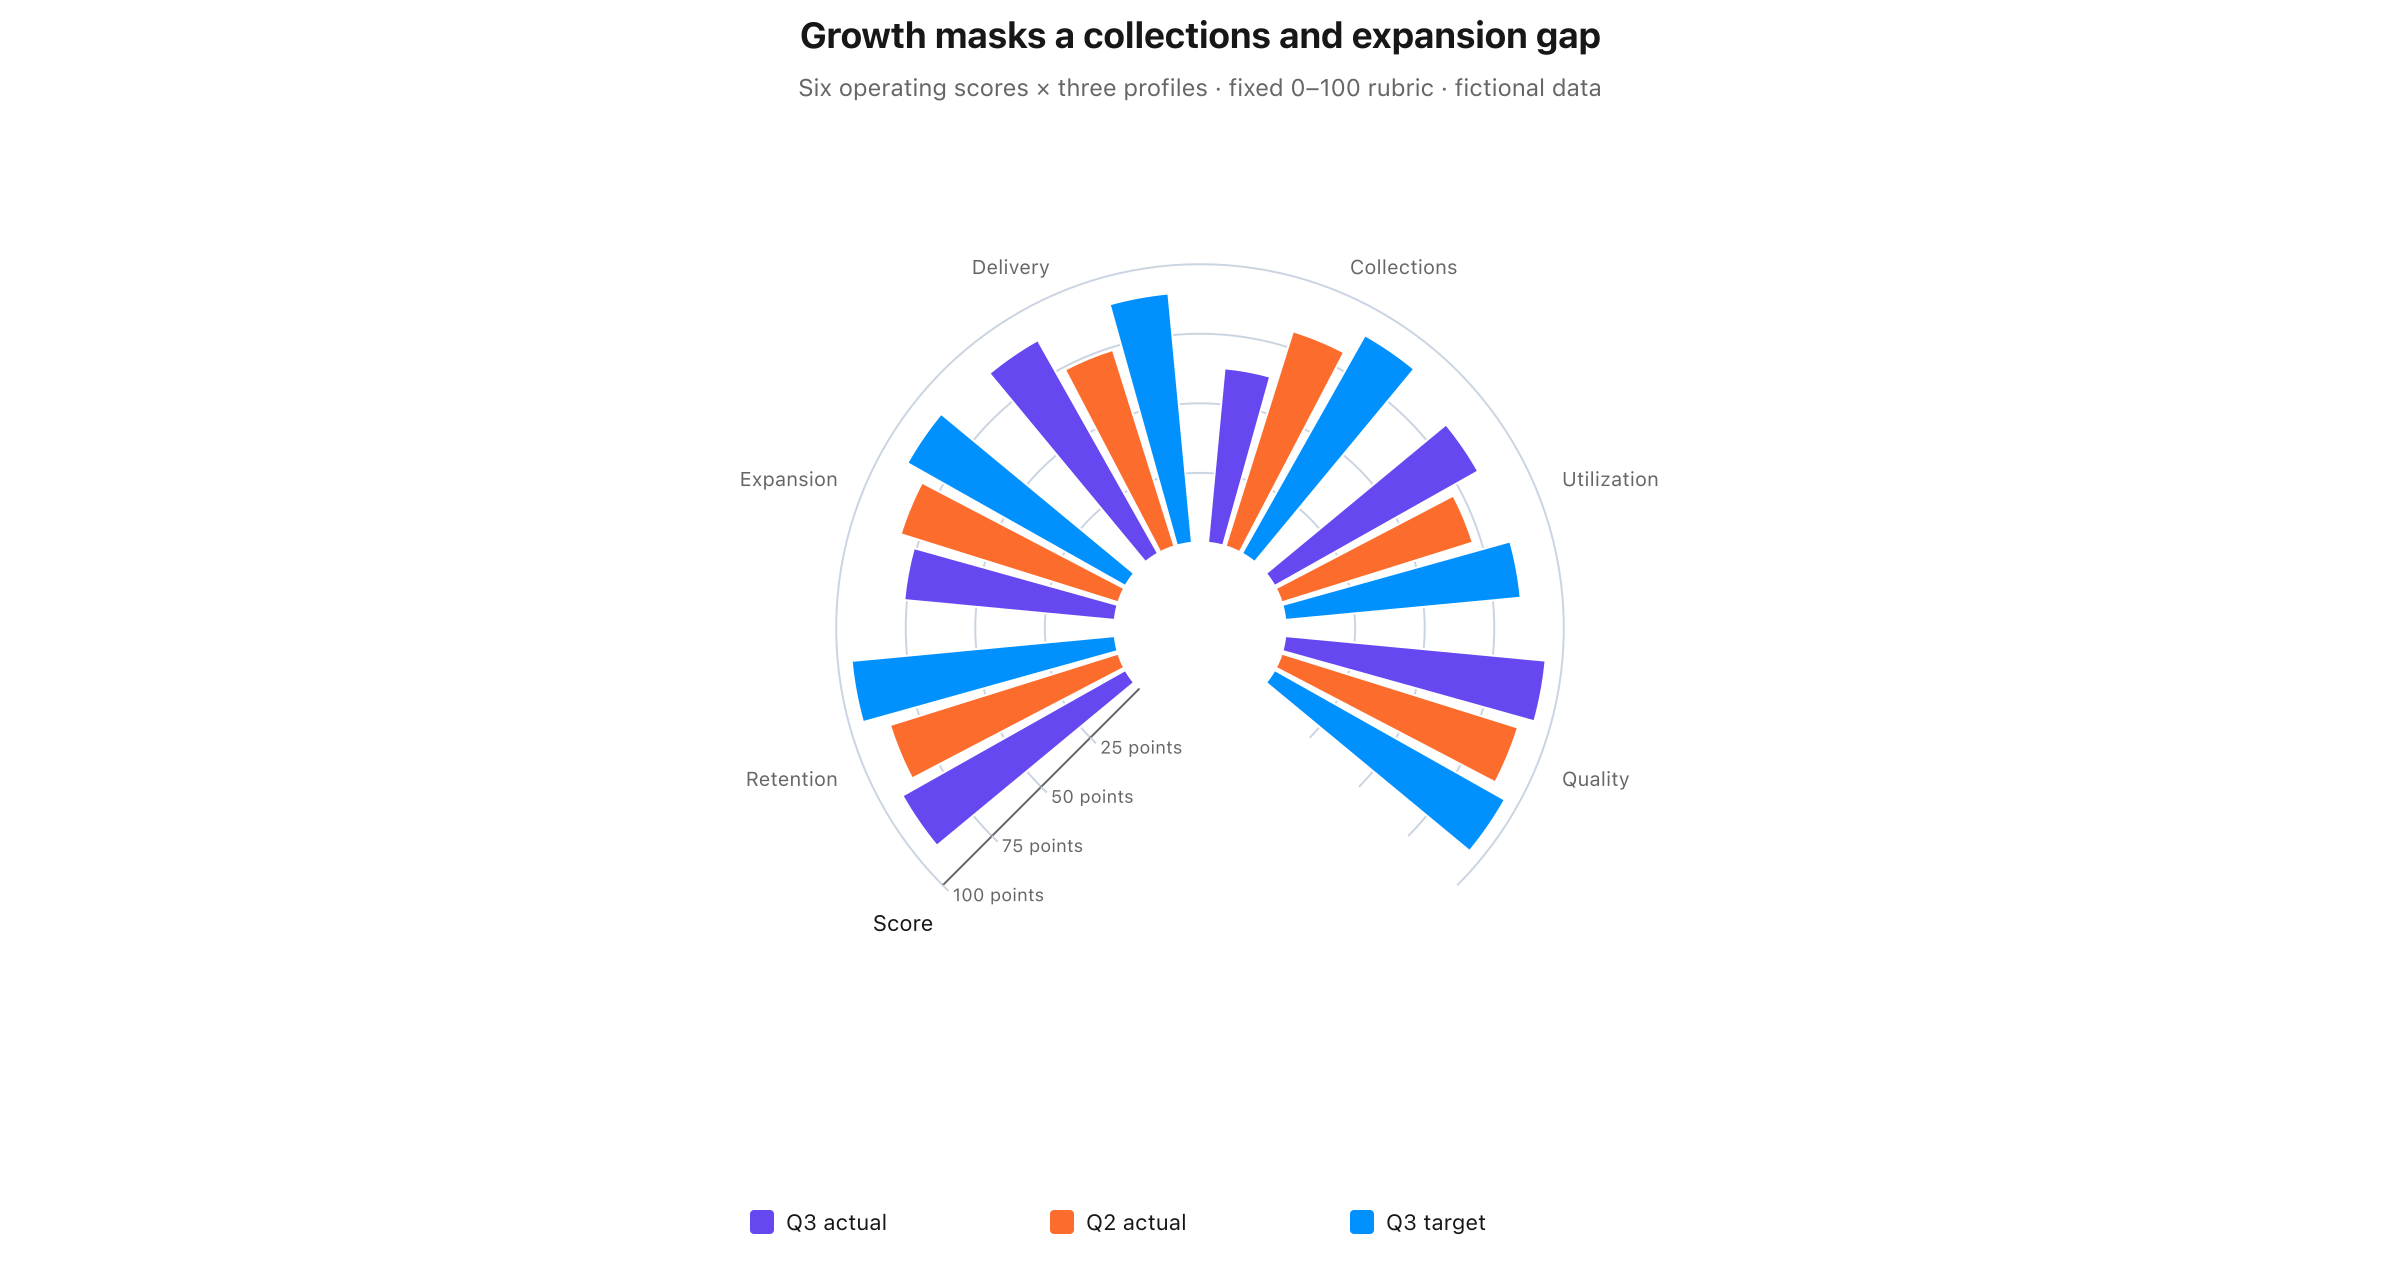
Choose complex business charts: grouped polar profiles, stacked actual-versus-budget series, weighted histogram bins, allocation flows, forecasts and price-volume analysis.

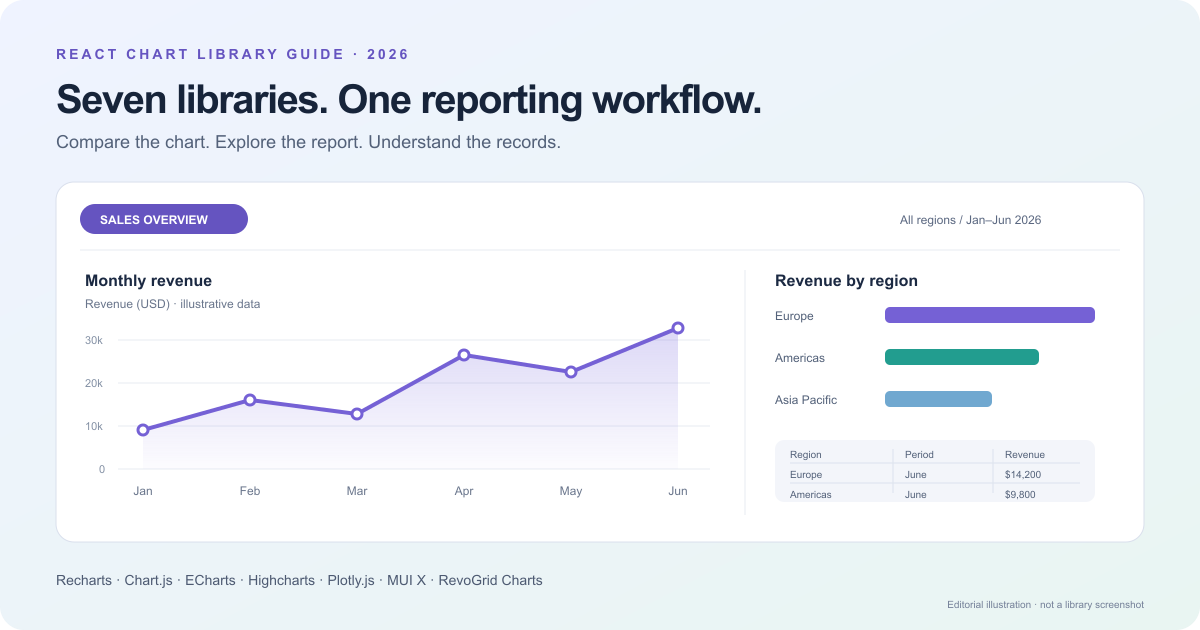
Compare 7 React chart libraries for BI dashboards: Recharts, Chart.js, ECharts, Highcharts, Plotly.js, MUI X, and RevoGrid. See features and trade-offs.

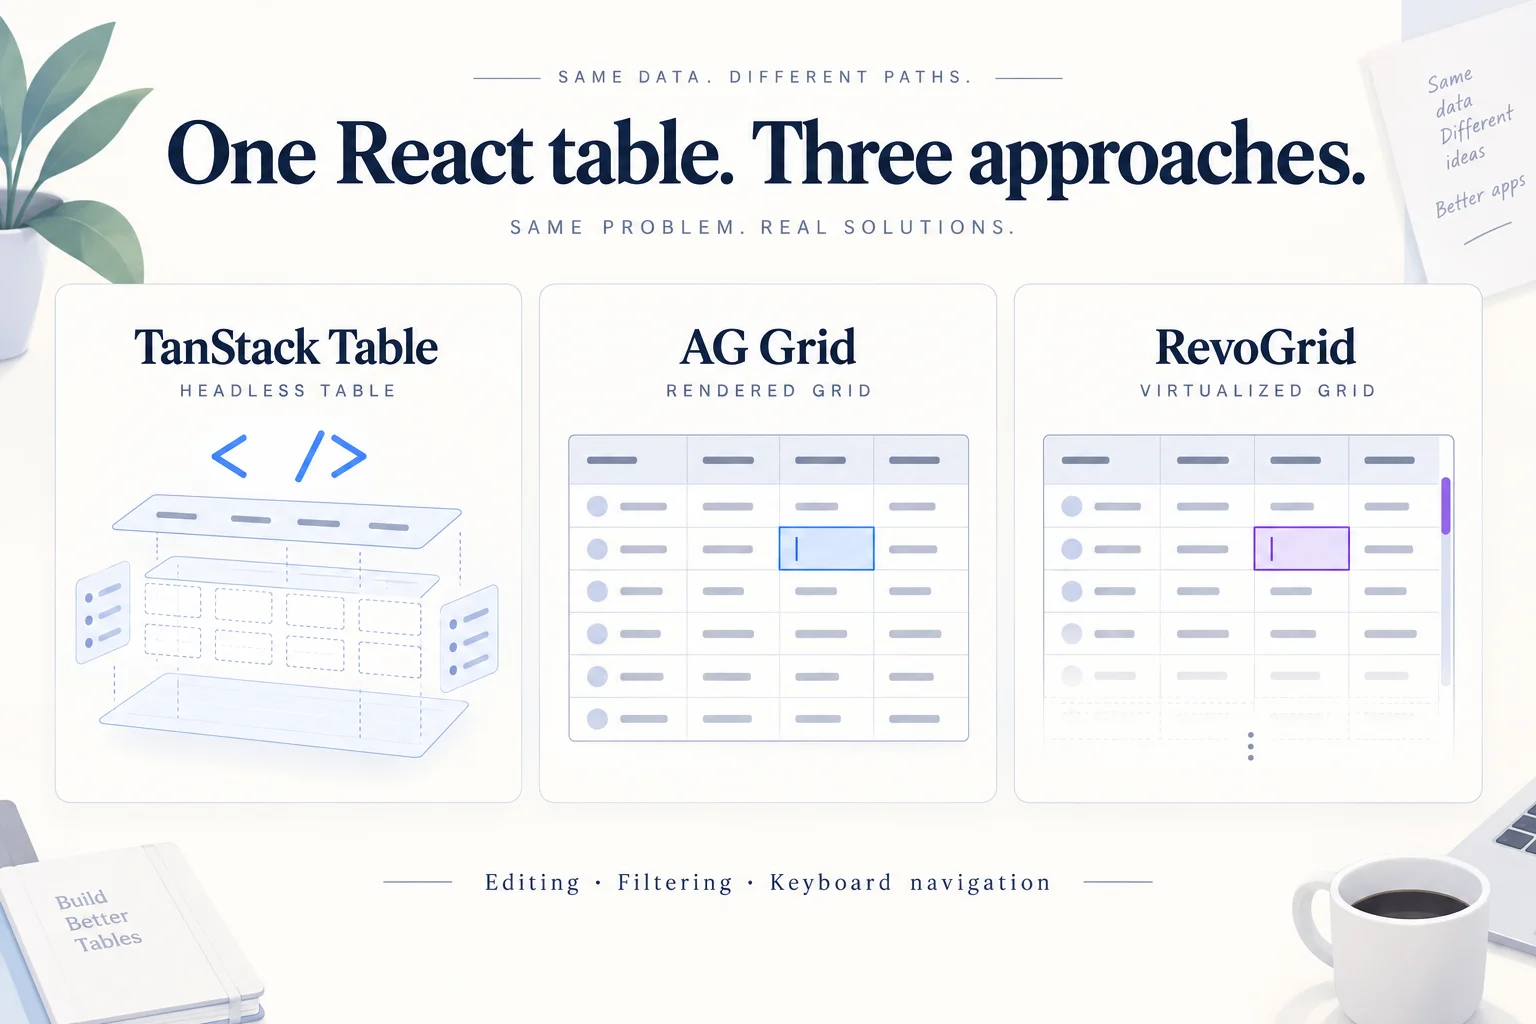
One editable React table, three approaches. See which editing, filtering, and keyboard behaviors the library handles—and which your application owns.

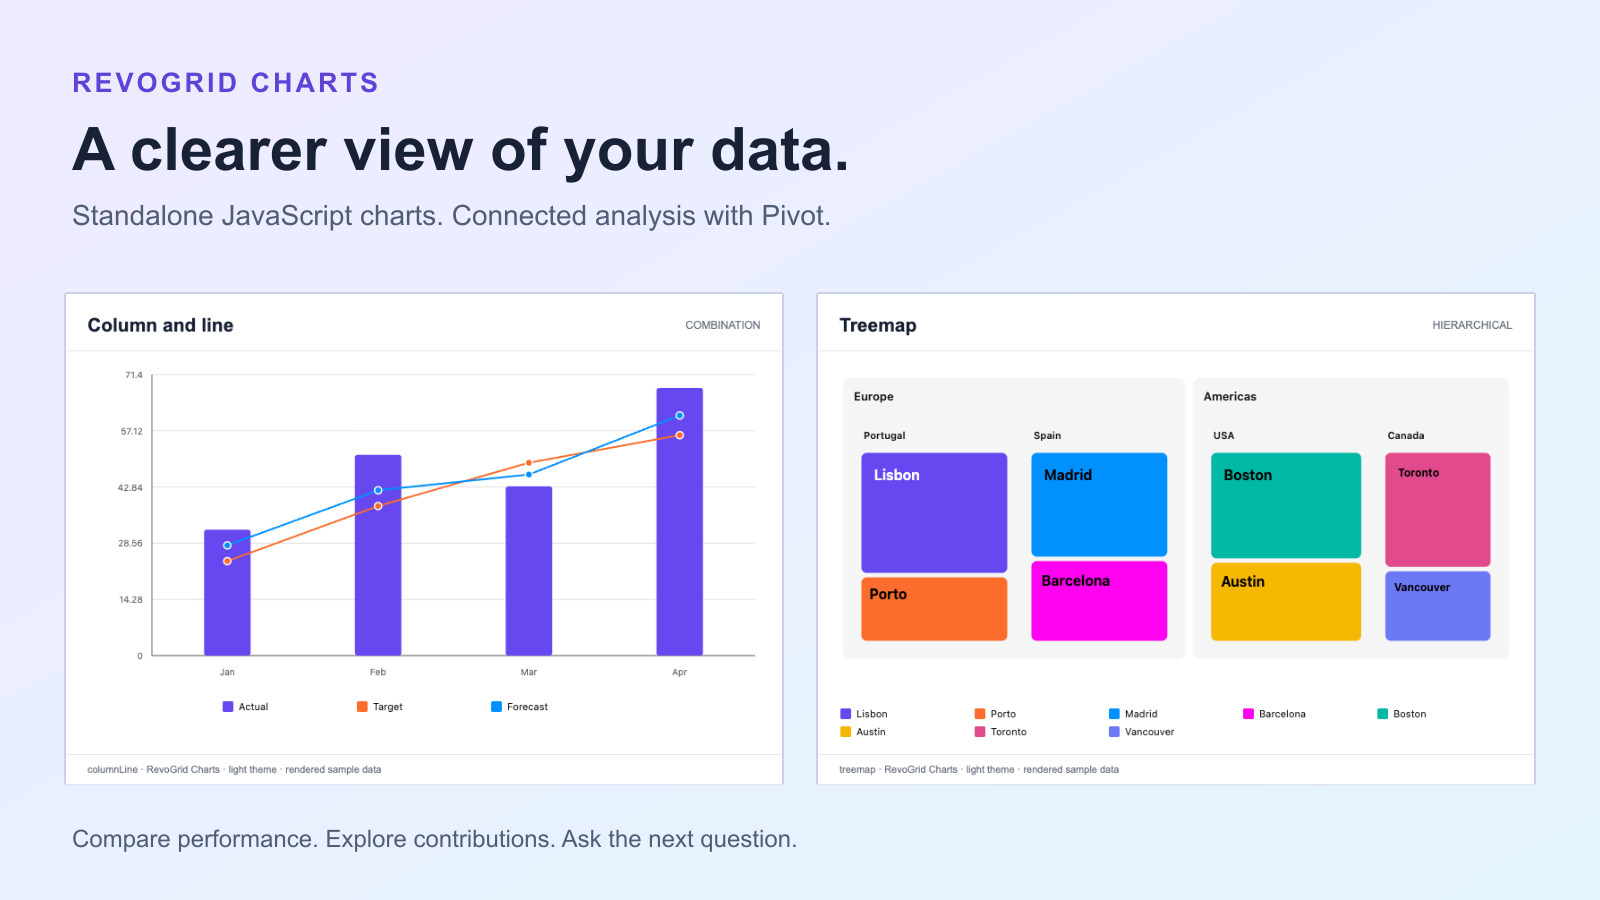
Explore RevoGrid Charts through four dashboard questions: compare categories, track targets, reveal hierarchies, and spot patterns. Start standalone, then connect to Pivot.

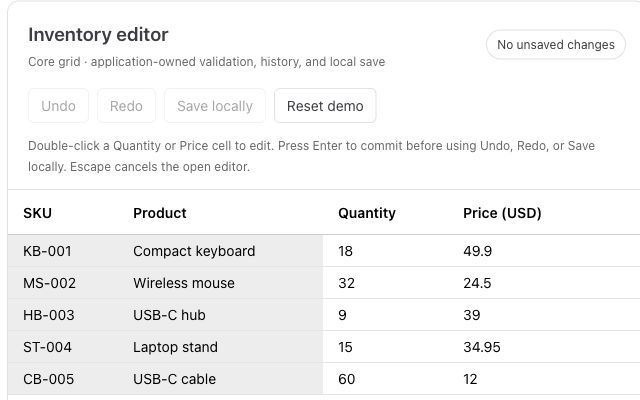
Paste from Excel, validate inventory, and add undo and redo to a working editor.

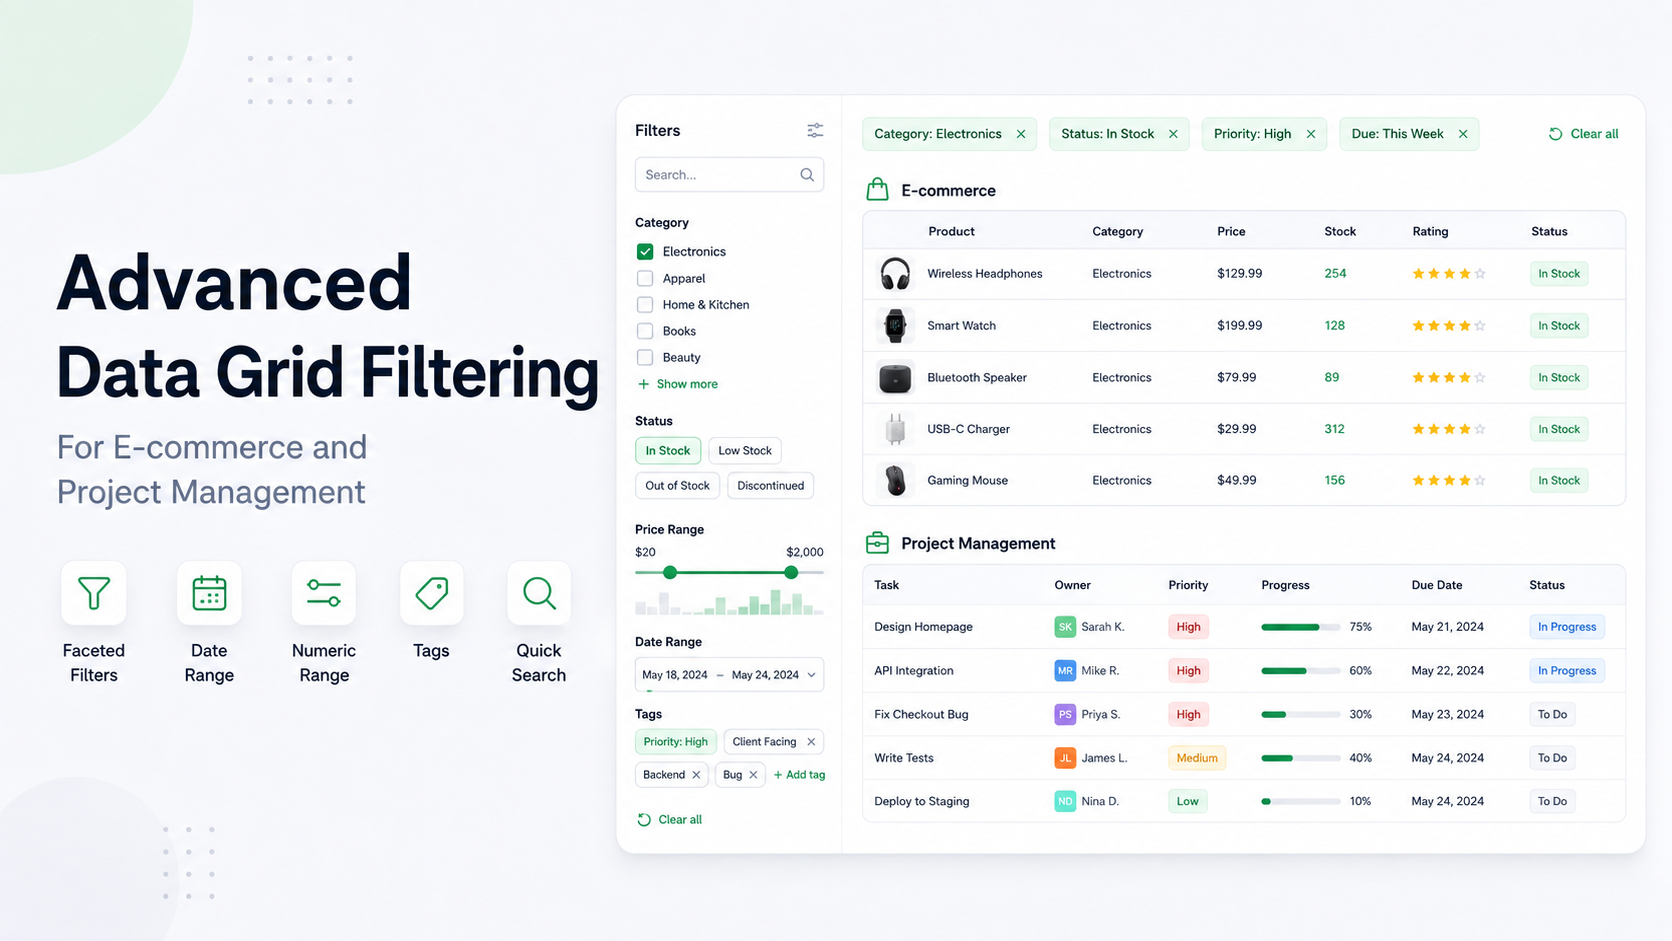
Practical filtering patterns for orders, inventory, and project workflows.

Bring editing, clipboard workflows, and large datasets into your web app.

Create a typed drag-and-drop board with editing, WIP limits, and persistence.

Keep large workflows responsive with virtualization and a single data model.

Compare framework support, workflow controls, performance, and licensing.

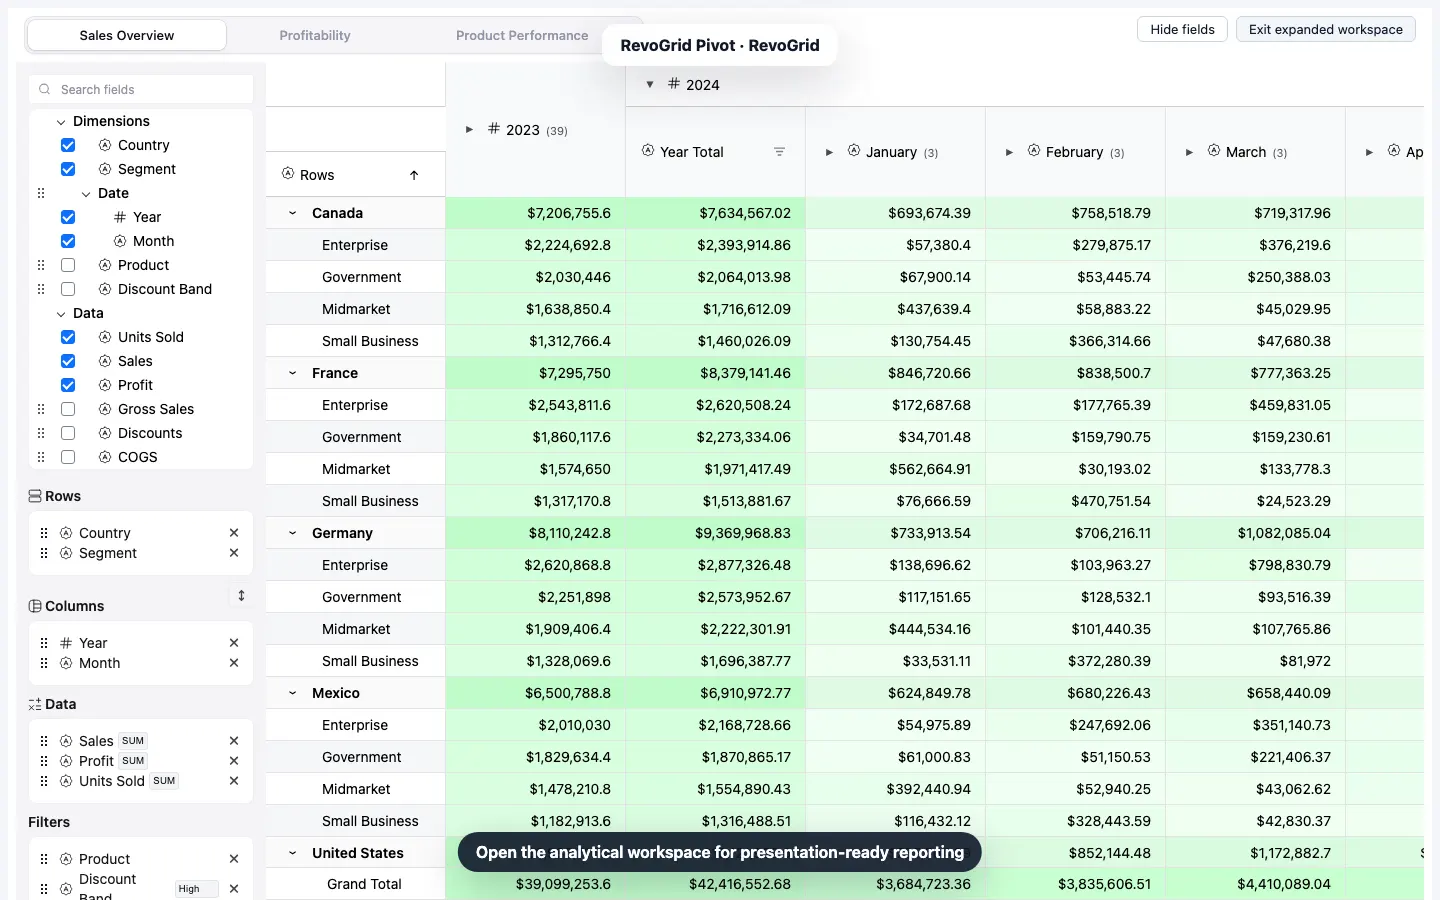
Build a typed React pivot table with drag-and-drop fields, totals, a custom aggregation, a linked chart, Excel-friendly CSV export, saved state, and a 350,000-row benchmark.

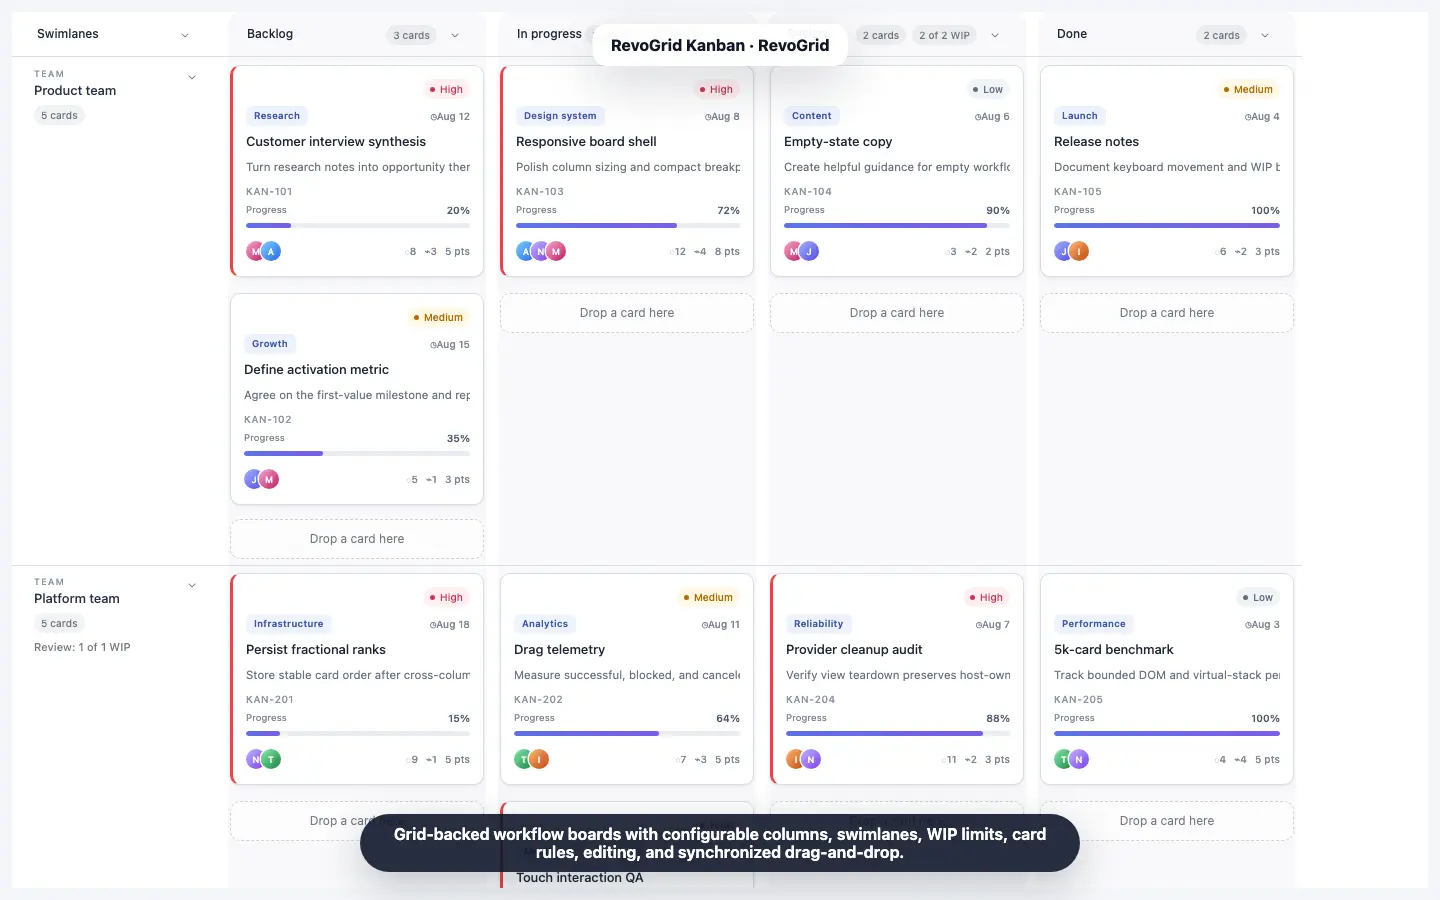
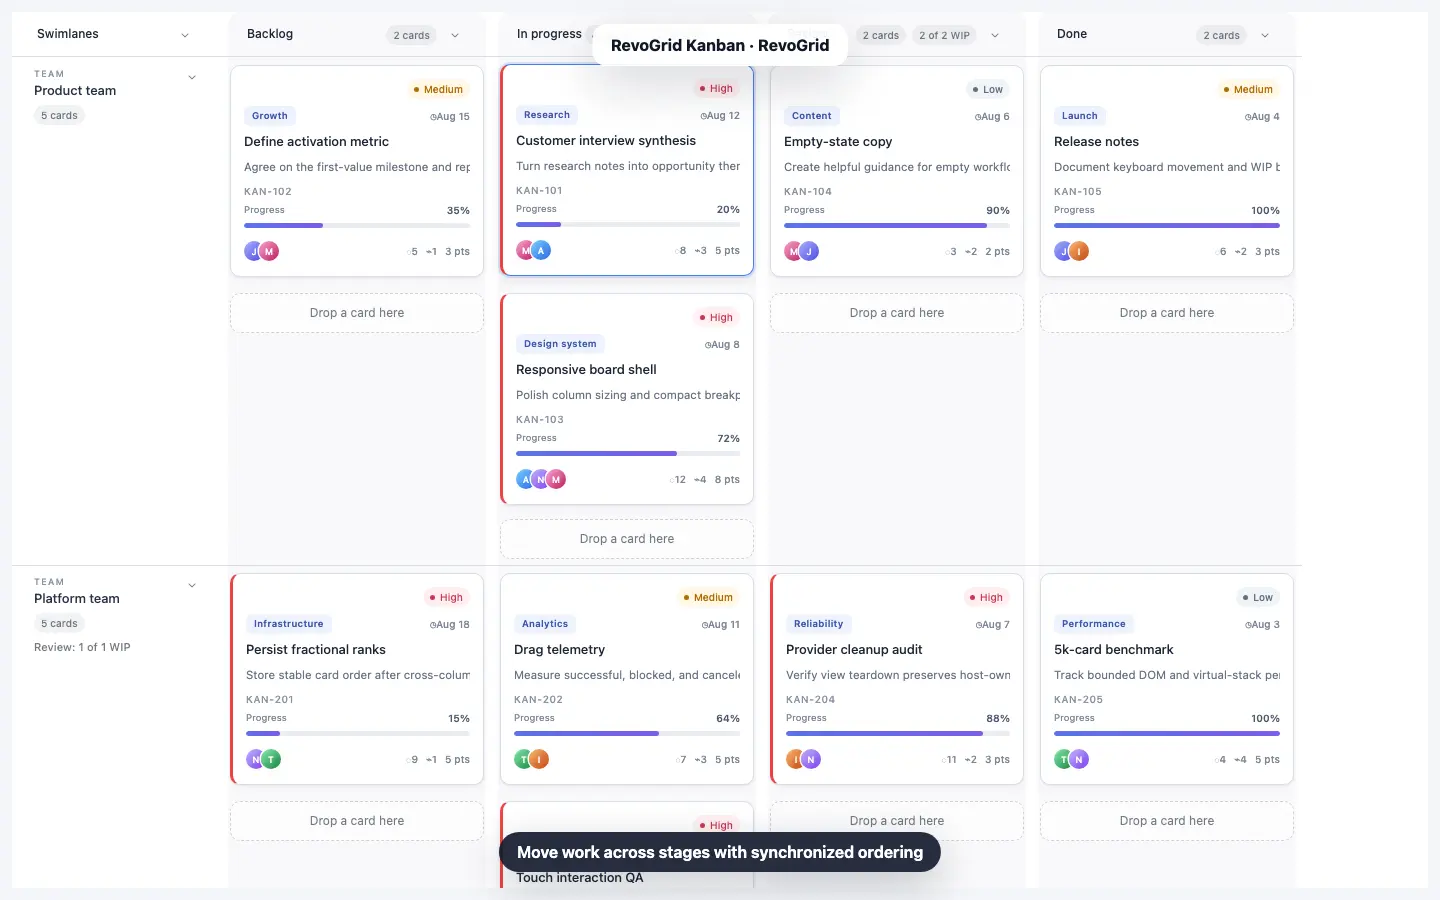
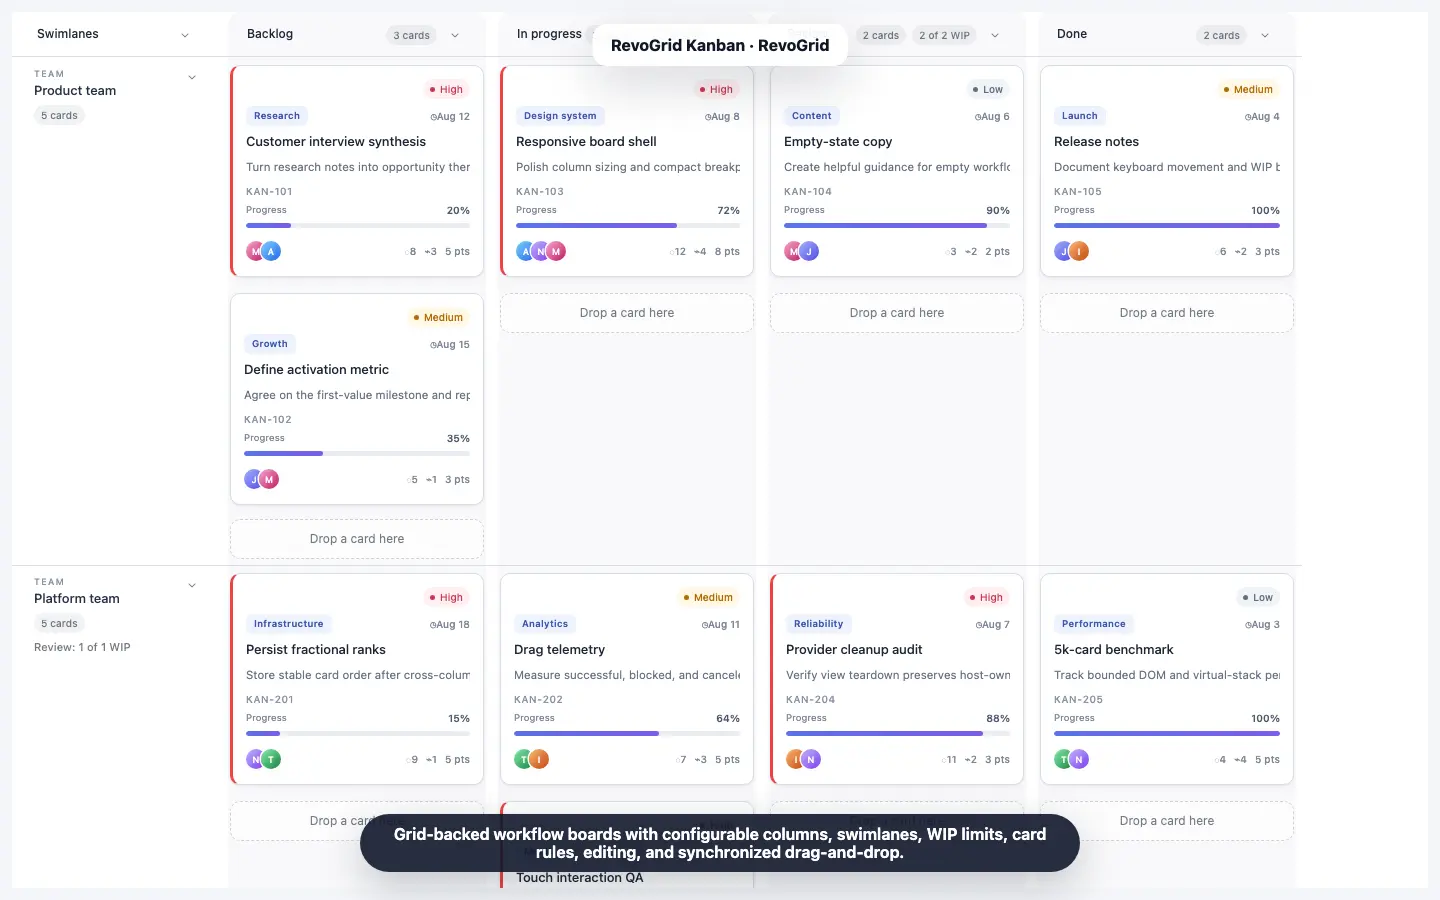
Meet RevoGrid Kanban, a virtualized Kanban board component and JavaScript with drag-and-drop, swimlanes, WIP limits, and custom cards.

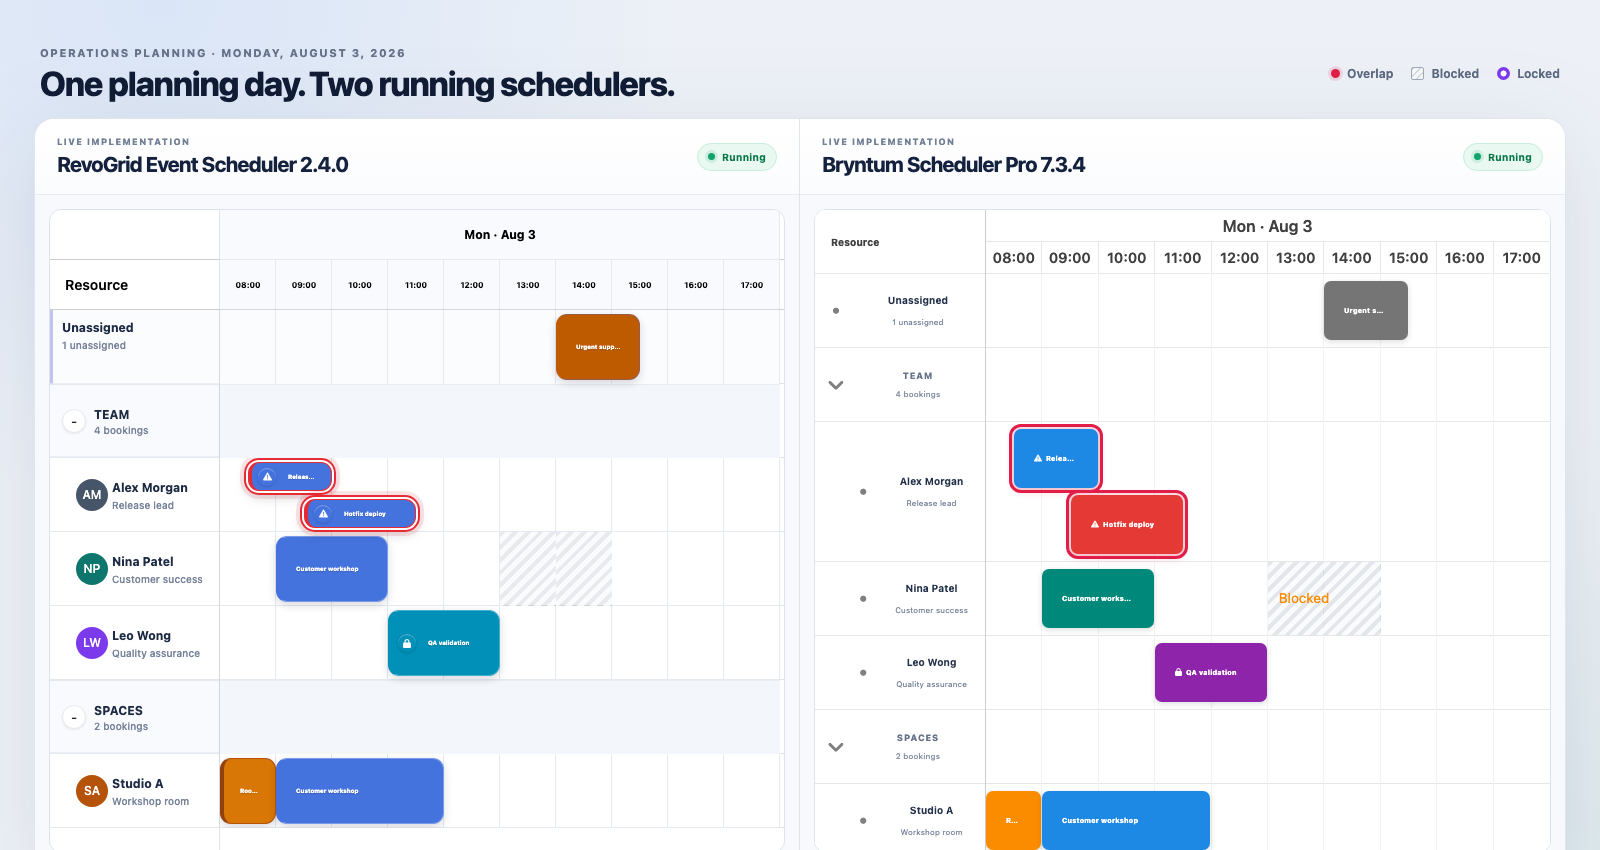
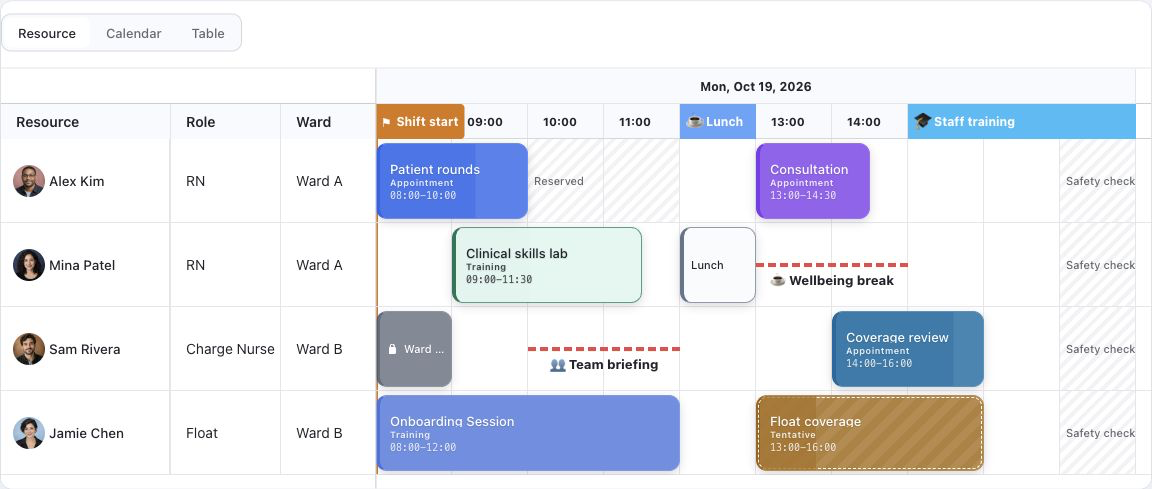
Compare RevoGrid Scheduler 2.4.0 with Bryntum Scheduler Pro 7.3.4 across resource timelines, editing, conflicts, architecture, and product fit.

Build a fast, editable Python Dash data grid with RevoGrid. Learn installation, Pandas integration, sorting, filtering, callbacks, and virtual scrolling.

Compare the best Dash data grids in 2026: RevoGrid for Dash, Dash AG Grid, Dash Glide Grid, Dash DataTable, and Dash Tabulator.

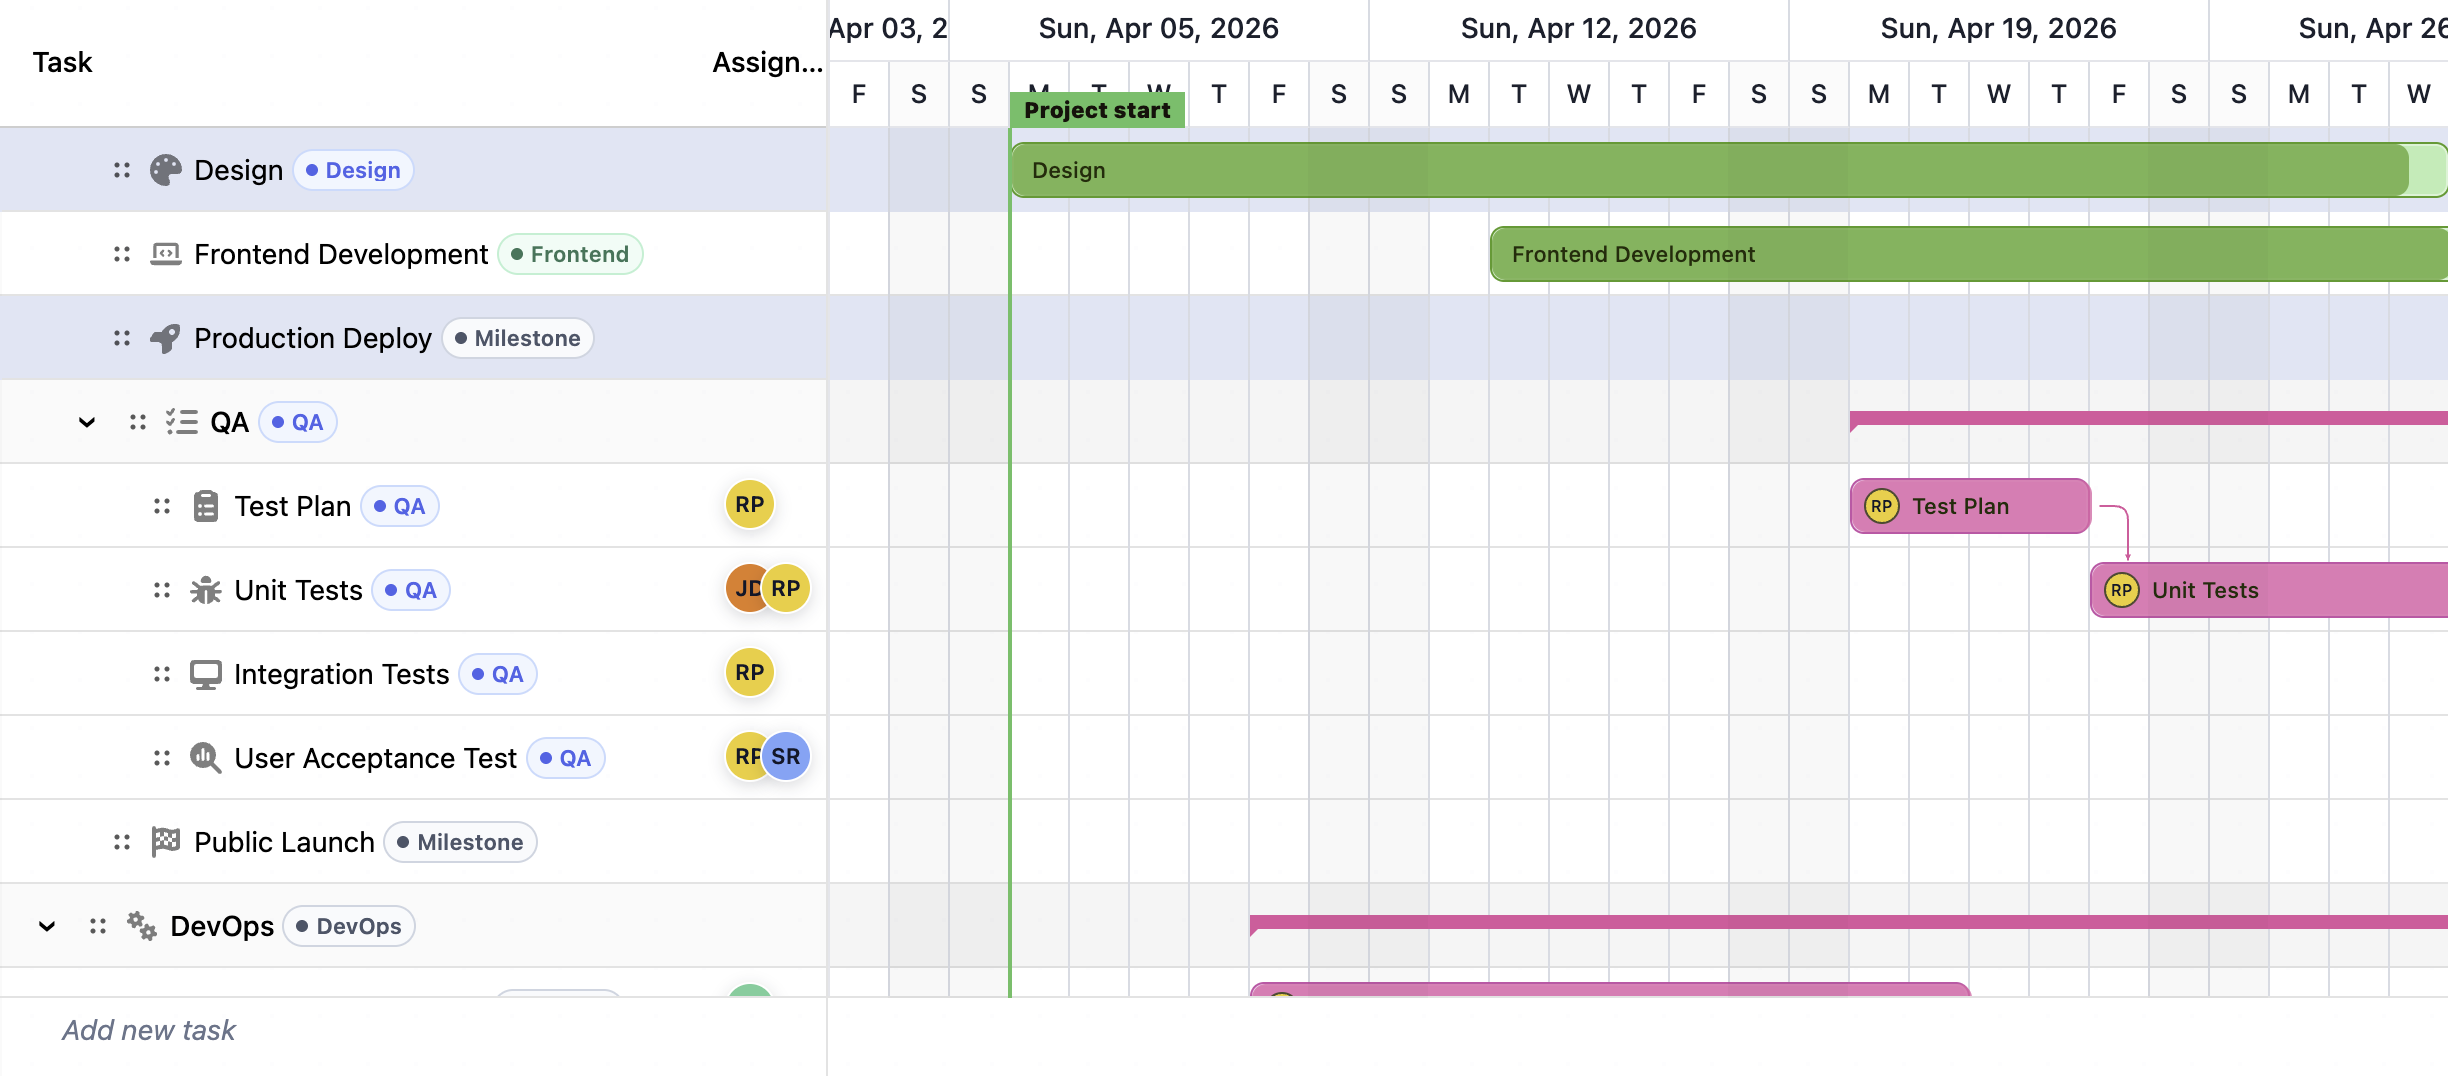
Compare the best JavaScript Gantt chart libraries in 2026: RevoGrid Gantt, Bryntum, DHTMLX, Syncfusion, Webix, Highcharts, AnyGantt, and Frappe Gantt.

A practical look at how RevoGrid exposes docs to AI agents with llms.txt, MCP, and split reference files, and how you can do the same.

Learn JavaScript Gantt chart dependencies: FS, SS, FF, SF, lead and lag, validation, auto-scheduling, and interactive link editing.

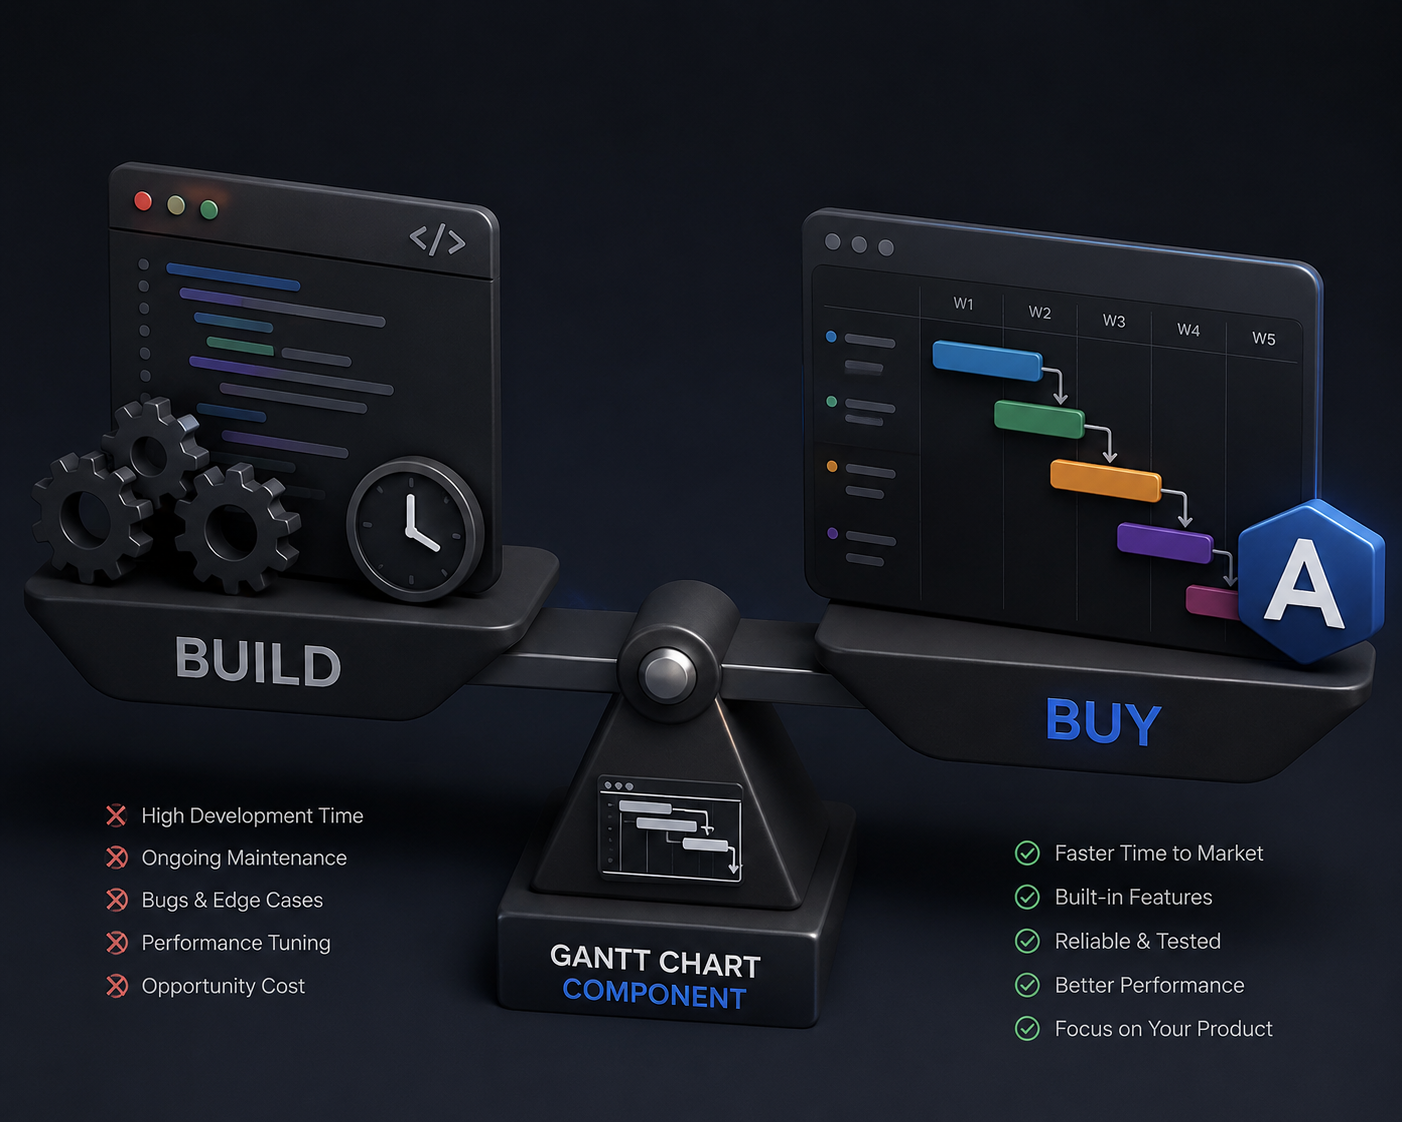
Compare building a React Gantt chart with buying a React Gantt chart component. See where RevoGrid Gantt, Syncfusion, and SVAR fit.

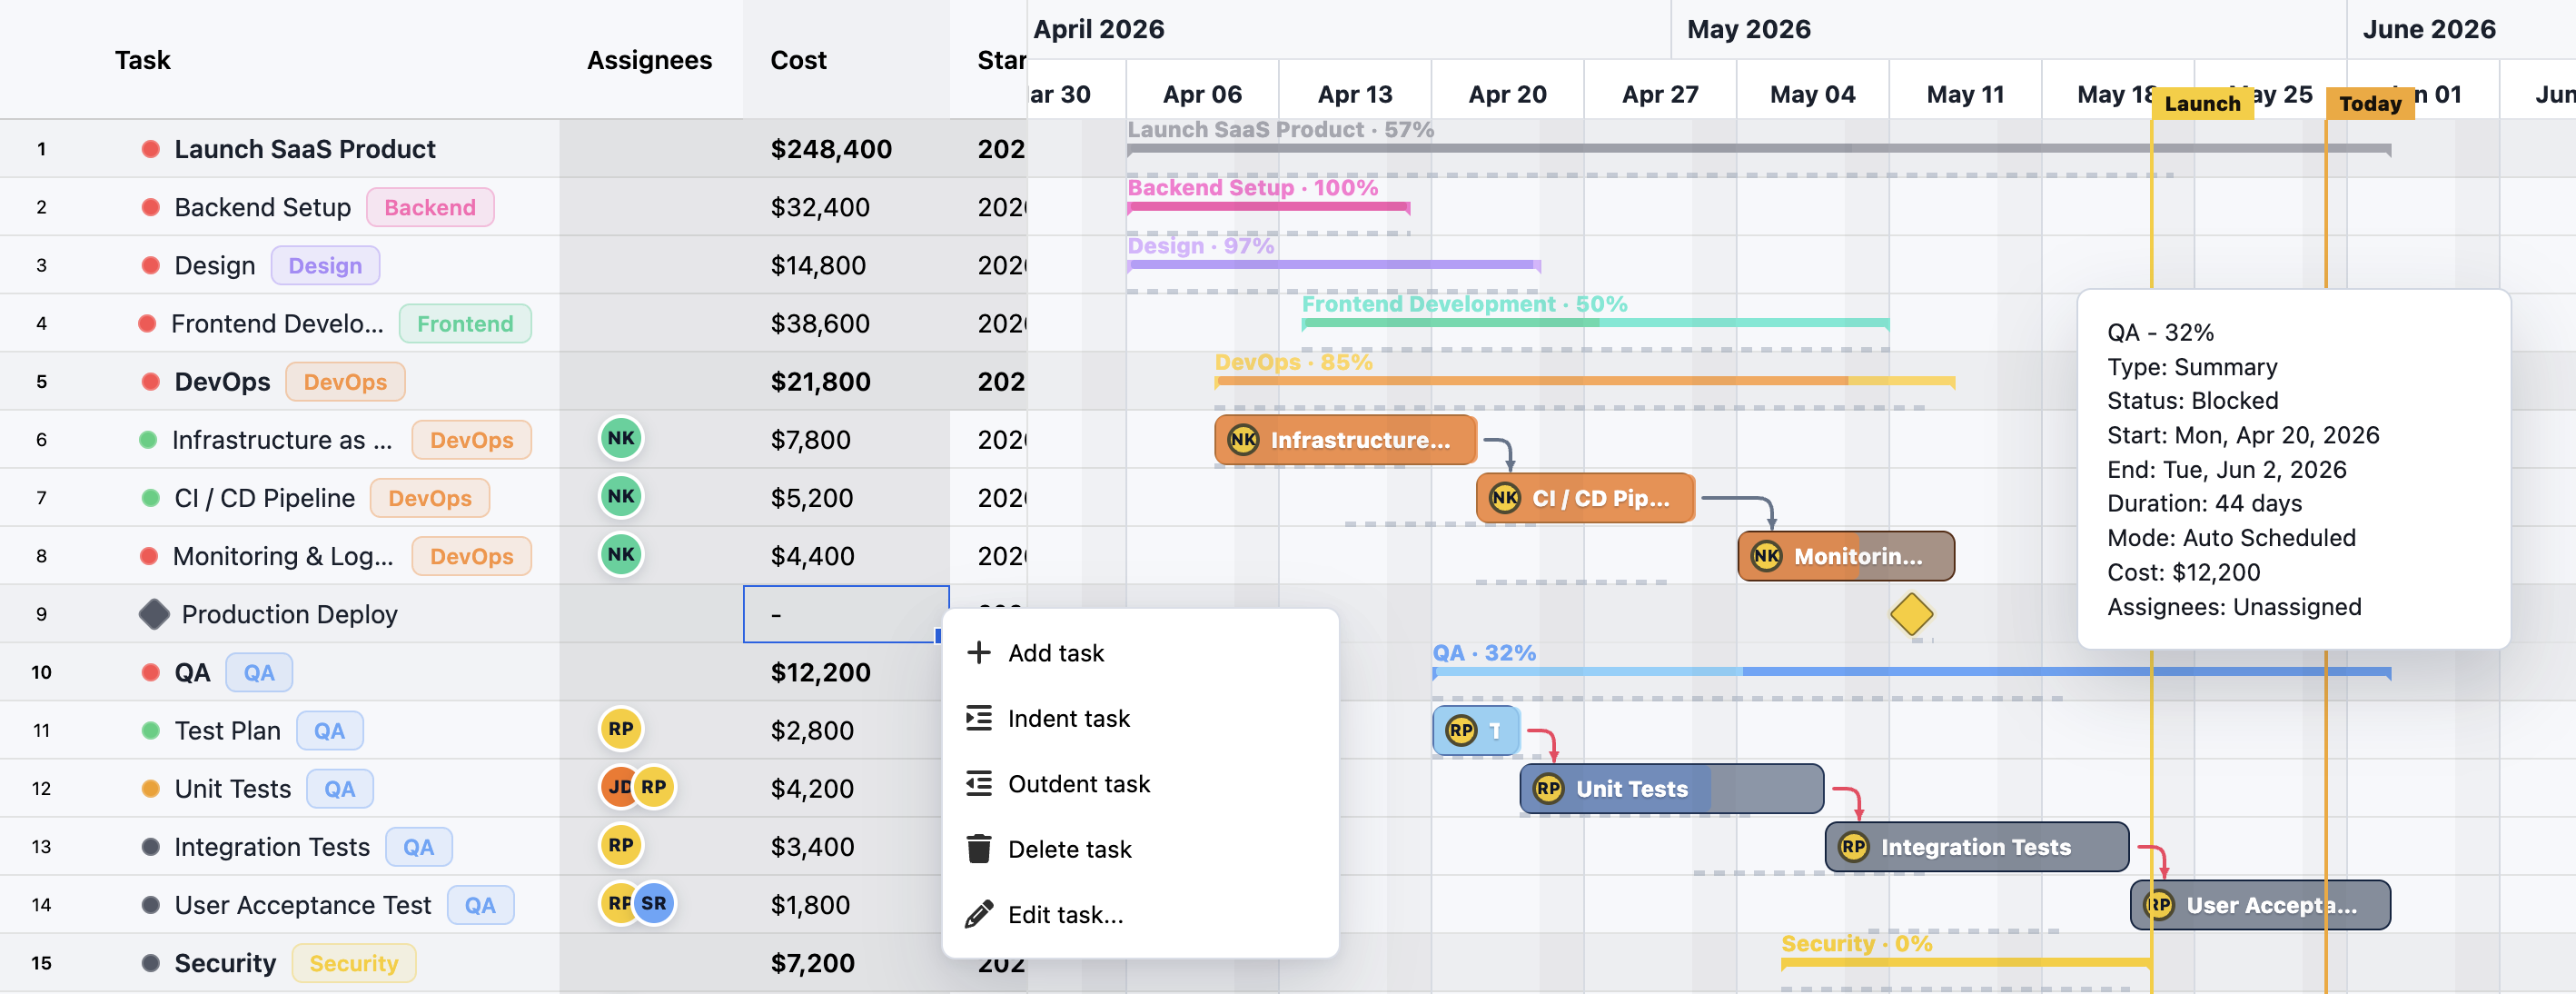
A business-focused guide to automatic scheduling, calendars, dependency logic, critical path, resource capacity, and planning use cases in RevoGrid Gantt.

Microsoft Project is changing as Project for the web moves into Planner and Project Online retires. See why teams need an embeddable Gantt and scheduler.

Compare five Angular data grids in 2026 by editing, virtualization, Angular integration, and licensing: AG Grid, RevoGrid, Kendo, Syncfusion, and DevExtreme.

Compare five Vue data grids in 2026 by editing, Vue 3 integration, virtualization, and licensing: AG Grid, RevoGrid, PrimeVue, Syncfusion, and Handsontable.

Build real-time collaborative spreadsheet-like data grids, including multi-user editing, presence, conflict resolution, permissions, audit history & formulas.

Design enterprise dashboards with JavaScript data grids using practical patterns for UX, performance, security, analytics, and operational workflows.

Compare five React data grids in 2026 by editing, virtualization, licensing, and fit: AG Grid, RevoGrid, Handsontable, Jspreadsheet, and SpreadJS.

A practical AG Grid to RevoGrid migration guide for JavaScript, React, Vue, Angular, and Svelte teams moving rowData, columnDefs, renderers, editors, events, filtering, sorting, selection, and advanced grid workflows.

Learn how to migrate from Syncfusion Grid to RevoGrid with API mappings, framework examples, editing, filtering, sorting, paging, and virtualization.

Migrate from Handsontable to RevoGrid with API mappings, JavaScript and framework examples, workflow guidance, and a practical checklist.

RevoGrid Pro 2+ brings visual update highlights, Pivot analytics, Gantt scheduling, enterprise billing control, AI and MCP workflows, server-side data patterns, spreadsheet features, audit history, and a larger demo platform.

Compare the best JavaScript data grid libraries in 2026: AG Grid, RevoGrid, Handsontable, MUI X Data Grid, Tabulator, SlickGrid, and Glide Data Grid.

Compare JavaScript pivot table components, pivot grids, reporting tools, and spreadsheet engines, including RevoGrid Pivot for embedded analytics.

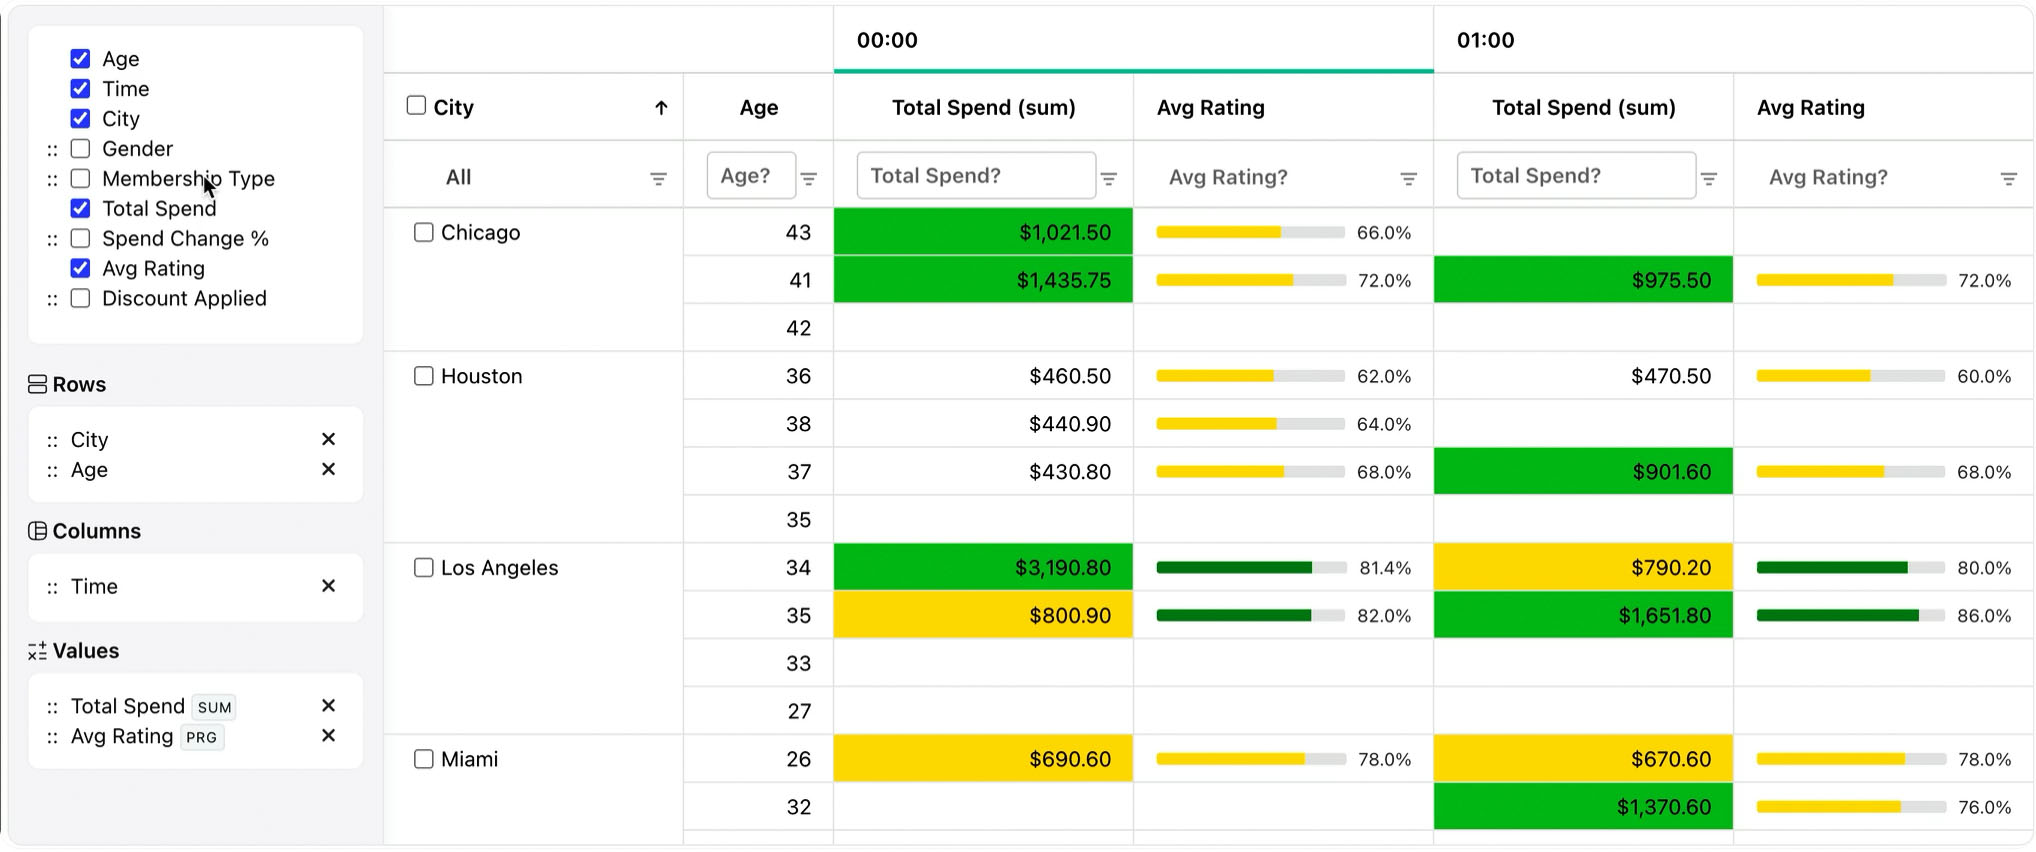
Learn what pivot tables are, how rows, columns, values, filters, and aggregations work, and how RevoGrid Pivot supports embedded analytics in web apps.

Compare JavaScript resource scheduler and event calendar libraries for staff shifts, bookings, availability, recurring events, and frontend integration.

Do you need a data grid or a simple HTML table? Compare editing, filtering and performance, try a live example, and choose what fits your app.
A good place to start