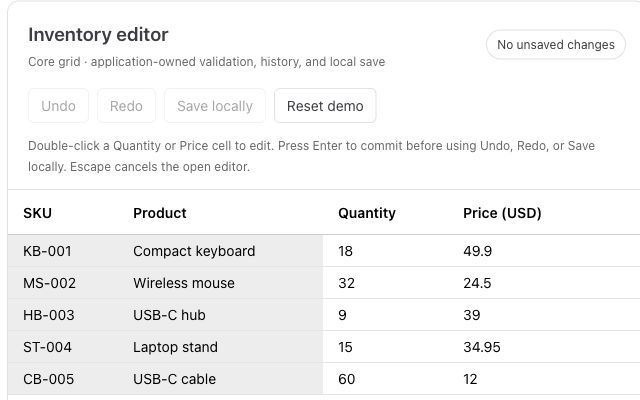
The example derives all three from the same filtered invoice records in React state.
Build a React Invoice Dashboard with RevoGrid and Revo UI
A React invoice dashboard should answer two questions together: which invoices match the current filters, and what do those invoices add up to? If the grid, chart, and total use different filtering logic, a screen can show plausible numbers that disagree.
This tutorial builds a dashboard in which all three views use the same filtered records. We will use Revo UI for text input, status selection, badges, buttons, a theme switch, and an area chart, then RevoGrid for React for the invoice details.
The complete example includes:
- Search by client name or invoice number.
- Pending, Paid, and Overdue status filters.
- A visible invoice count, total value, and area chart grouped by due date.
- A read-only data grid and an explicit empty-result message.
- A reset action and coordinated light and dark themes.
The records are illustrative sample data. Invoice status is stored explicitly; this example does not infer overdue status from today's date or connect to an accounting service.
Try the invoice dashboard
Open the dashboard in its own tab. Search for Acme, select Pending, and watch the grid, total, and chart update together.
Run the complete example
Download the React example and extract it. The archive includes the source, styles, package manifest, and lockfile. Use Node.js 22.13 or newer.
From the extracted revo-ui-invoice-dashboard directory, run:
bash
npm ci
npm run dev
Open the local URL printed by Vite. To verify the production build, run:
bash
npm run buildThe example pins @revolist/[email protected], @revolist/[email protected], React 19.3.1, and Vite 8.3.7. To add the component packages to an existing compatible React app, use:
bash
npm install @revolist/[email protected] @revolist/[email protected] [email protected]pdfjs-dist is included because Vite's optimizer resolves optional PDF viewer assets through the UI package in this release. This dashboard does not initialize a PDF viewer, so it needs no PDF worker configuration. The downloadable starter is the reproducible setup used for this tutorial.
For the broader library and the Vue, Angular, Svelte, Preact, and vanilla TypeScript routes, see Revo UI components and framework setup.
Import the shared styles
Load the library CSS before your application styles in src/main.tsx:
ts
import '@revolist/ui/styles.css';
import './styles.css';
The application stylesheet defines the page layout and uses Revo UI's semantic tokens for its panels, text, and borders. The controls themselves use the library stylesheet.
Build the invoice dashboard
Use the following component as src/App.tsx. The grid columns and sample invoices are defined outside the component so their configuration stays stable across renders.
tsx
import { useEffect, useMemo, useState } from 'react'
import { AreaChart, Badge, Button, SegmentedSwitch, Switch, TextInput } from '@revolist/ui/react'
import { RevoGrid, type ColumnRegular } from '@revolist/react-datagrid'

type Status = 'Pending' | 'Paid' | 'Overdue'
type StatusFilter = 'All' | Status
type Invoice = {
  id: string
  client: string
  status: Status
  amount: number
  due: string
}

// Sample data stays immutable. All views derive from the same filtered rows.
const invoices: Invoice[] = [
  { id: 'INV-1001', client: 'Acme Labs', status: 'Pending', amount: 2400, due: '2026-11-12' },
  { id: 'INV-1002', client: 'Orbit Design', status: 'Paid', amount: 1850, due: '2026-11-03' },
  { id: 'INV-1003', client: 'Forma Studio', status: 'Overdue', amount: 3200, due: '2026-11-01' },
  { id: 'INV-1004', client: 'Acme Labs', status: 'Paid', amount: 1200, due: '2026-11-05' },
  { id: 'INV-1005', client: 'Northstar', status: 'Pending', amount: 2750, due: '2026-11-18' },
  { id: 'INV-1006', client: 'Orbit Design', status: 'Overdue', amount: 950, due: '2026-11-02' },
]
const statuses: Status[] = ['Pending', 'Paid', 'Overdue']
const statusOptions = ['All', ...statuses].map(value => ({ value, label: value }))
const columns: ColumnRegular[] = [
  { prop: 'id', name: 'Invoice', size: 140 },
  { prop: 'client', name: 'Client', size: 230 },
  { prop: 'status', name: 'Status', size: 130 },
  { prop: 'due', name: 'Due date', size: 150 },
  { prop: 'amount', name: 'Amount (USD)', size: 150 },
]
const money = (value: number) =>
  new Intl.NumberFormat('en-US', {
    style: 'currency',
    currency: 'USD',
    maximumFractionDigits: 0,
  }).format(value)

export default function App() {
  const [query, setQuery] = useState('')
  const [status, setStatus] = useState<StatusFilter>('All')
  const [dark, setDark] = useState(false)

  useEffect(() => {
    document.documentElement.dataset.theme = dark ? 'dark' : 'light'
  }, [dark])

  const search = query.trim().toLowerCase()
  const visible = useMemo(
    () =>
      invoices.filter(
        invoice =>
          (status === 'All' || invoice.status === status) &&
          `${invoice.id} ${invoice.client}`.toLowerCase().includes(search),
      ),
    [search, status],
  )
  const total = visible.reduce((sum, invoice) => sum + invoice.amount, 0)
  // Keep a stable date axis so filtered and empty results remain comparable.
  const chartData = [...new Set(invoices.map(invoice => invoice.due))].sort().map(date => {
    const value = visible
      .filter(invoice => invoice.due === date)
      .reduce((sum, invoice) => sum + invoice.amount, 0)
    return {
      key: `Nov ${date.slice(-2)}`,
      value,
      tooltip: { title: date, details: [money(value)] },
    }
  })

  const outstanding = visible
    .filter(invoice => invoice.status !== 'Paid')
    .reduce((sum, invoice) => sum + invoice.amount, 0)
  const overdueCount = visible.filter(invoice => invoice.status === 'Overdue').length

  return (
    <main className="dashboard rv-ui">
      <header className="dashboard-header">
        <div>
          <p className="eyebrow">FINANCE / ACCOUNTS RECEIVABLE</p>
          <h1>Invoice overview</h1>
          <p className="intro">A clear picture of what is paid, pending, and needs attention.</p>
        </div>
        <Switch label="Dark theme" checked={dark} onChange={setDark} />
      </header>
      <section className="metrics" aria-label="Invoice summary">
        <article className="metric">
          <span>Visible invoices</span>
          <strong>{visible.length}</strong>
          <small>Matching your filters</small>
        </article>
        <article className="metric">
          <span>Total value</span>
          <strong>{money(total)}</strong>
          <small>Across visible invoices</small>
        </article>
        <article className="metric">
          <span>Outstanding</span>
          <strong>{money(outstanding)}</strong>
          <small>
            {overdueCount} overdue {overdueCount === 1 ? 'invoice' : 'invoices'}
          </small>
        </article>
      </section>
      <section className="panel chart-panel" aria-labelledby="chart-heading">
        <div className="section-heading">
          <div>
            <span className="kicker">DUE DATE OVERVIEW</span>
            <h2 id="chart-heading">Invoice value by due date</h2>
            <p>Based on the invoices matching your filters</p>
          </div>
          <Badge variant="neutral">USD</Badge>
        </div>
        <AreaChart
          data={chartData}
          ariaLabel="Invoice value by due date in US dollars"
          height={165}
          showLabels
          showGrid
          showPoints
          areaFill="gradient"
          formatValue={money}
        />
      </section>
      <section className="panel records-panel" aria-labelledby="grid-heading">
        <div className="section-heading records-heading">
          <div>
            <span className="kicker">INVOICE ACTIVITY</span>
            <h2 id="grid-heading">Invoice details</h2>
            <p>Search and filter your invoice records</p>
          </div>
          <Badge variant="neutral">Sample data</Badge>
        </div>
        <div className="filters">
          <TextInput
            aria-label="Search invoices"
            placeholder="Search client or invoice number"
            value={query}
            onValueChange={setQuery}
          />
          <SegmentedSwitch
            className="status-filter"
            ariaLabel="Invoice status"
            role="radiogroup"
            options={statusOptions}
            value={status}
            onChange={value => setStatus(value as StatusFilter)}
          />
          <Button
            variant="secondary"
            onClick={() => {
              setQuery('')
              setStatus('All')
            }}
          >
            Reset filters
          </Button>
        </div>
        <p className="result-summary" role="status">
          <strong>
            {visible.length} {visible.length === 1 ? 'invoice' : 'invoices'}
          </strong>{' '}
          · Total value <strong>{money(total)}</strong>
        </p>
        {visible.length === 0 && <p className="empty-state">No invoices match these filters.</p>}
        <RevoGrid
          aria-label="Invoice details"
          columns={columns}
          source={visible}
          theme={dark ? 'darkCompact' : 'compact'}
          readonly
          style={{ height: '260px', width: '100%' }}
        />
      </section>
      <p className="footnote">Illustrative sample data · Status values are stored explicitly.</p>
    </main>
  )
}
The full layout stylesheet is included in the download. Its panel styles use --rv-ui-surface, --rv-ui-border, and --rv-ui-text, while the responsive filter layout stacks on narrower screens.
Keep the grid, chart, and total in sync
The important part of the implementation is the visible collection. It applies the text and status filters together. useMemo preserves that array between renders when the filter values are unchanged.
The grid receives visible through its source prop. The total reduces that same array, and the chart groups its values by due date. There is one decision about which invoices belong in the view.
For example, searching for Acme returns two invoices with a combined value of $3,600. Selecting Pending while that search remains active returns one invoice worth $2,400. The grid, count, total, and chart all reflect the combined filters.
This is application-controlled filtering. It is a useful choice when a toolbar controls multiple components. RevoGrid also supports grid filtering, which you can use for column-level workflows. If you add grid-local filters later, decide whether your surrounding summaries should follow those filters and connect them to the same effective result set.
Use each control's actual callback
The TextInput component calls onValueChange with a string. The SegmentedSwitch uses onChange and an options array containing value and label fields. Its radio-group role provides keyboard navigation between statuses.
The segmented switch emits the selected option value, which the handler stores in React state. React passes that status back through the value prop. The segmented control keeps the four choices visible. The reset button updates both filter states together.
For the AreaChart, each datum contains a key, a numeric value, and tooltip content. formatValue formats the displayed amounts without changing the numbers used in the calculations. ariaLabel names the chart for assistive technology.
Coordinate light and dark themes
The Switch changes one React state value. An effect applies data-theme="light" or data-theme="dark" to the document root, while the grid receives compact or darkCompact through its own theme prop.
Both components therefore follow the same application preference through their respective theme APIs. The Revo UI color reference documents the shared UI tokens, and the RevoGrid theme guide covers grid themes and customization.
This app controls the document theme because it owns the whole page. When embedding the dashboard inside a larger application, connect it to that application's existing theme state or scope the UI tokens to a wrapper.
Check the results
Run these checks in the example. The expected amounts come from its six sample records.
| Action | Visible invoices | Total value | Expected chart values |
|---|---|---|---|
| Open the dashboard | 6 | $12,350 | Six due dates, from Nov 1 to Nov 18 |
Search for Acme | 2 | $3,600 | Nov 5: $1,200; Nov 12: $2,400; other dates $0 |
Keep Acme and choose Pending | 1 | $2,400 | Nov 12: $2,400; other dates $0 |
Search for no-such-client | 0 | $0 | Every date $0; empty-result message visible |
| Click Reset filters | 6 | $12,350 | Original values restored |
| Switch the theme | Unchanged | Unchanged | Colors change; records and amounts stay the same |
These workflows can be checked in the embedded example or in the downloadable starter. The summary, chart, and grid all derive from the same filtered records.
Connect the pattern to your own application
Replace the sample array with records from your data layer, then keep the same relationship between filters and views. For a large dataset, move filtering and aggregation to your backend and return records and summary values for the same query. If the grid shows one page of invoices, a total calculated from that page should be labeled as a page total.
The grid is read-only in this example. To support edits, synchronize accepted changes with your application state while preserving stable active grid records. Recalculate the surrounding summaries from the updated values. The React grid guide and data loading and synchronization guide explain the next integration steps.
For stored monetary amounts with fractional units, use the representation and rounding rules required by your application, such as integer minor units. The whole-dollar sample data here keeps the filtering example easy to inspect.
Start by running the complete example, then explore the Revo UI component gallery for the next part of your workflow.
FAQ