


01 / Pro Lite
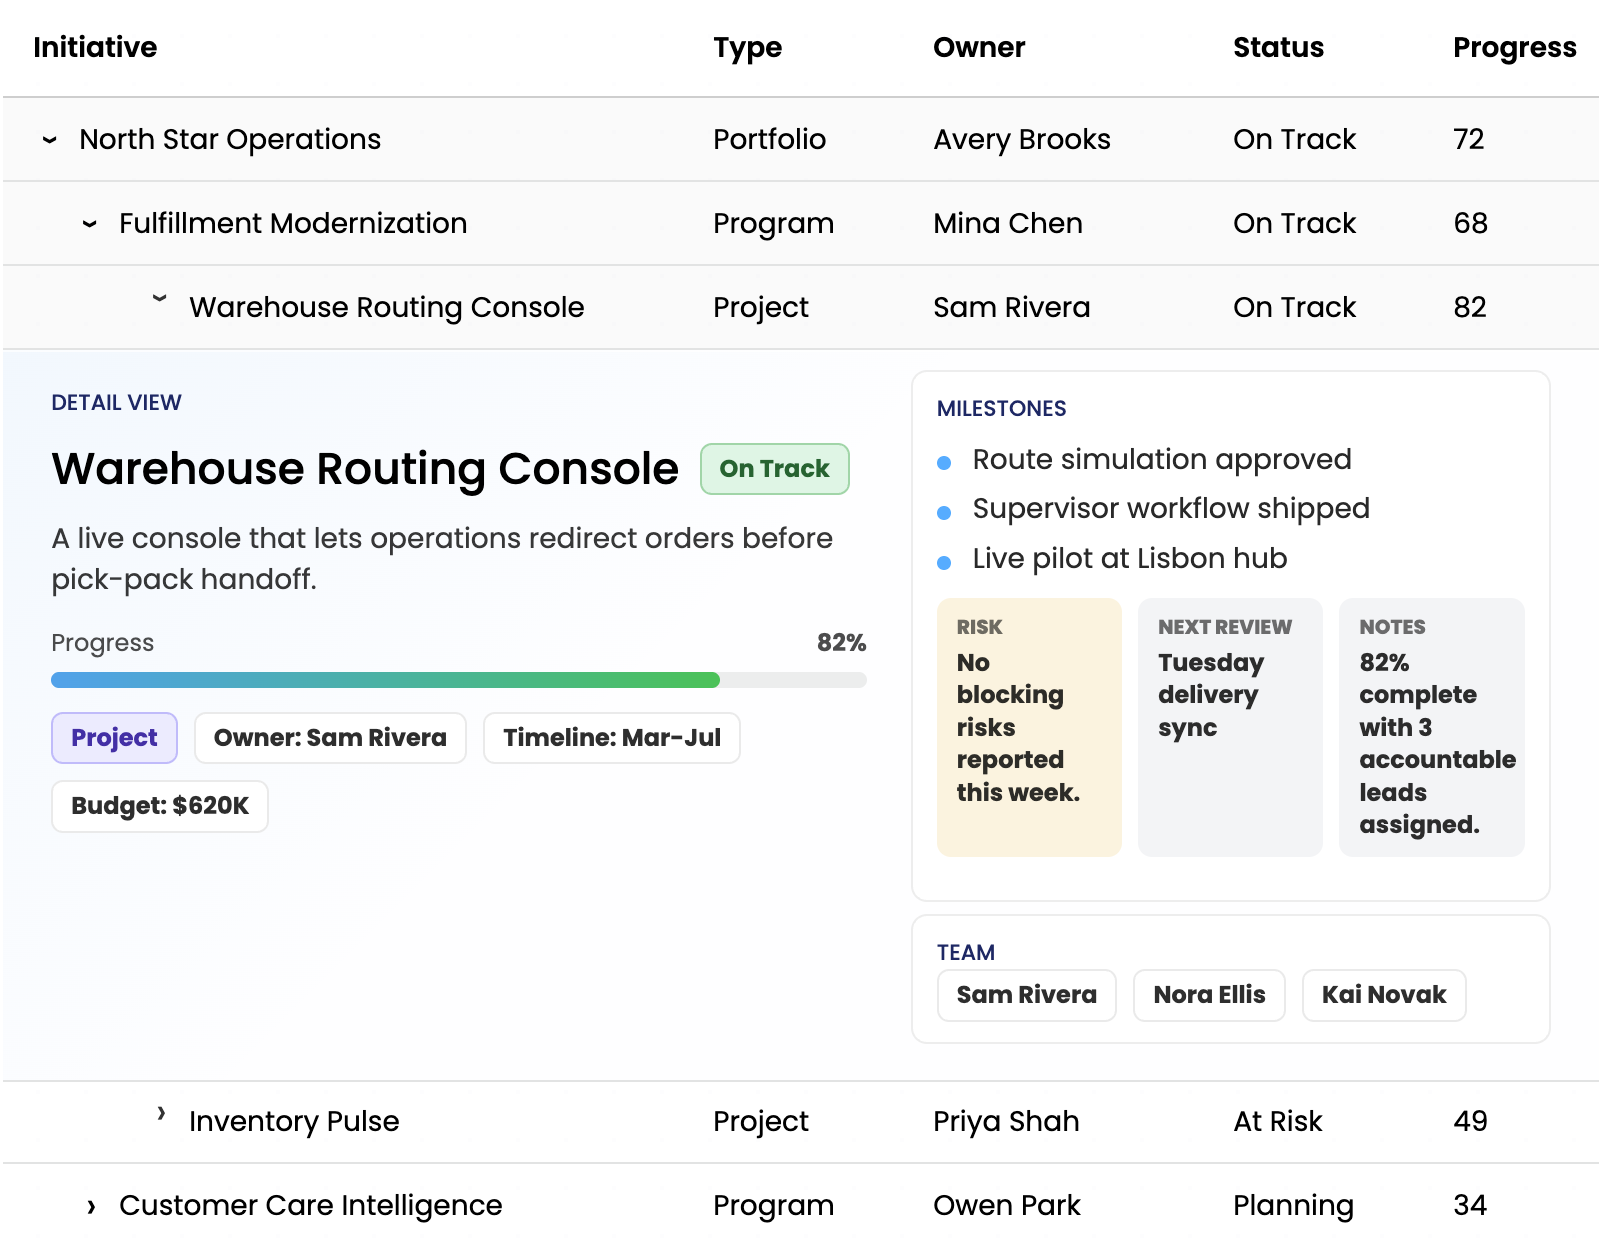
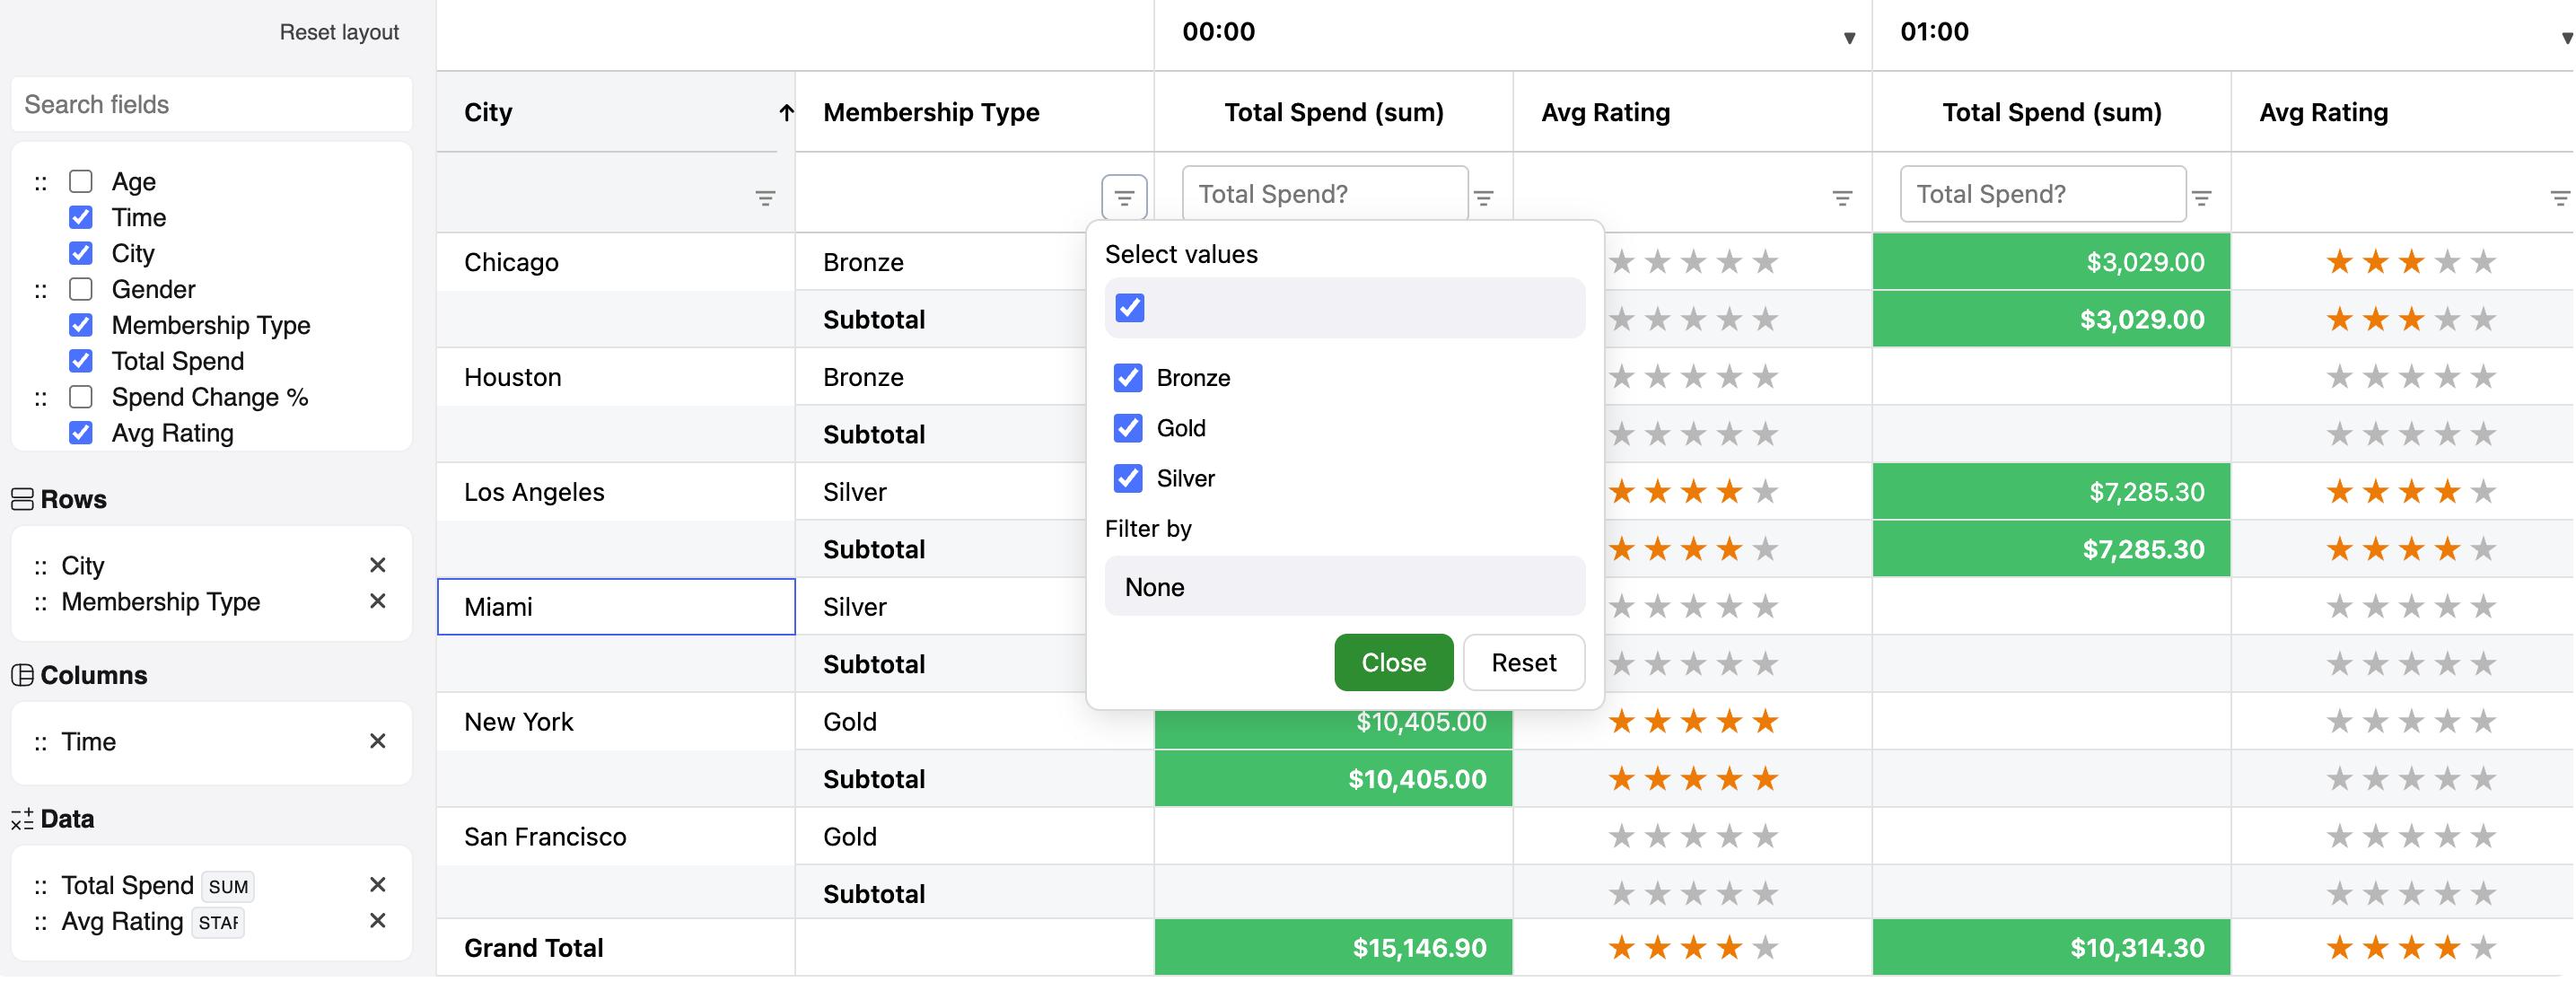
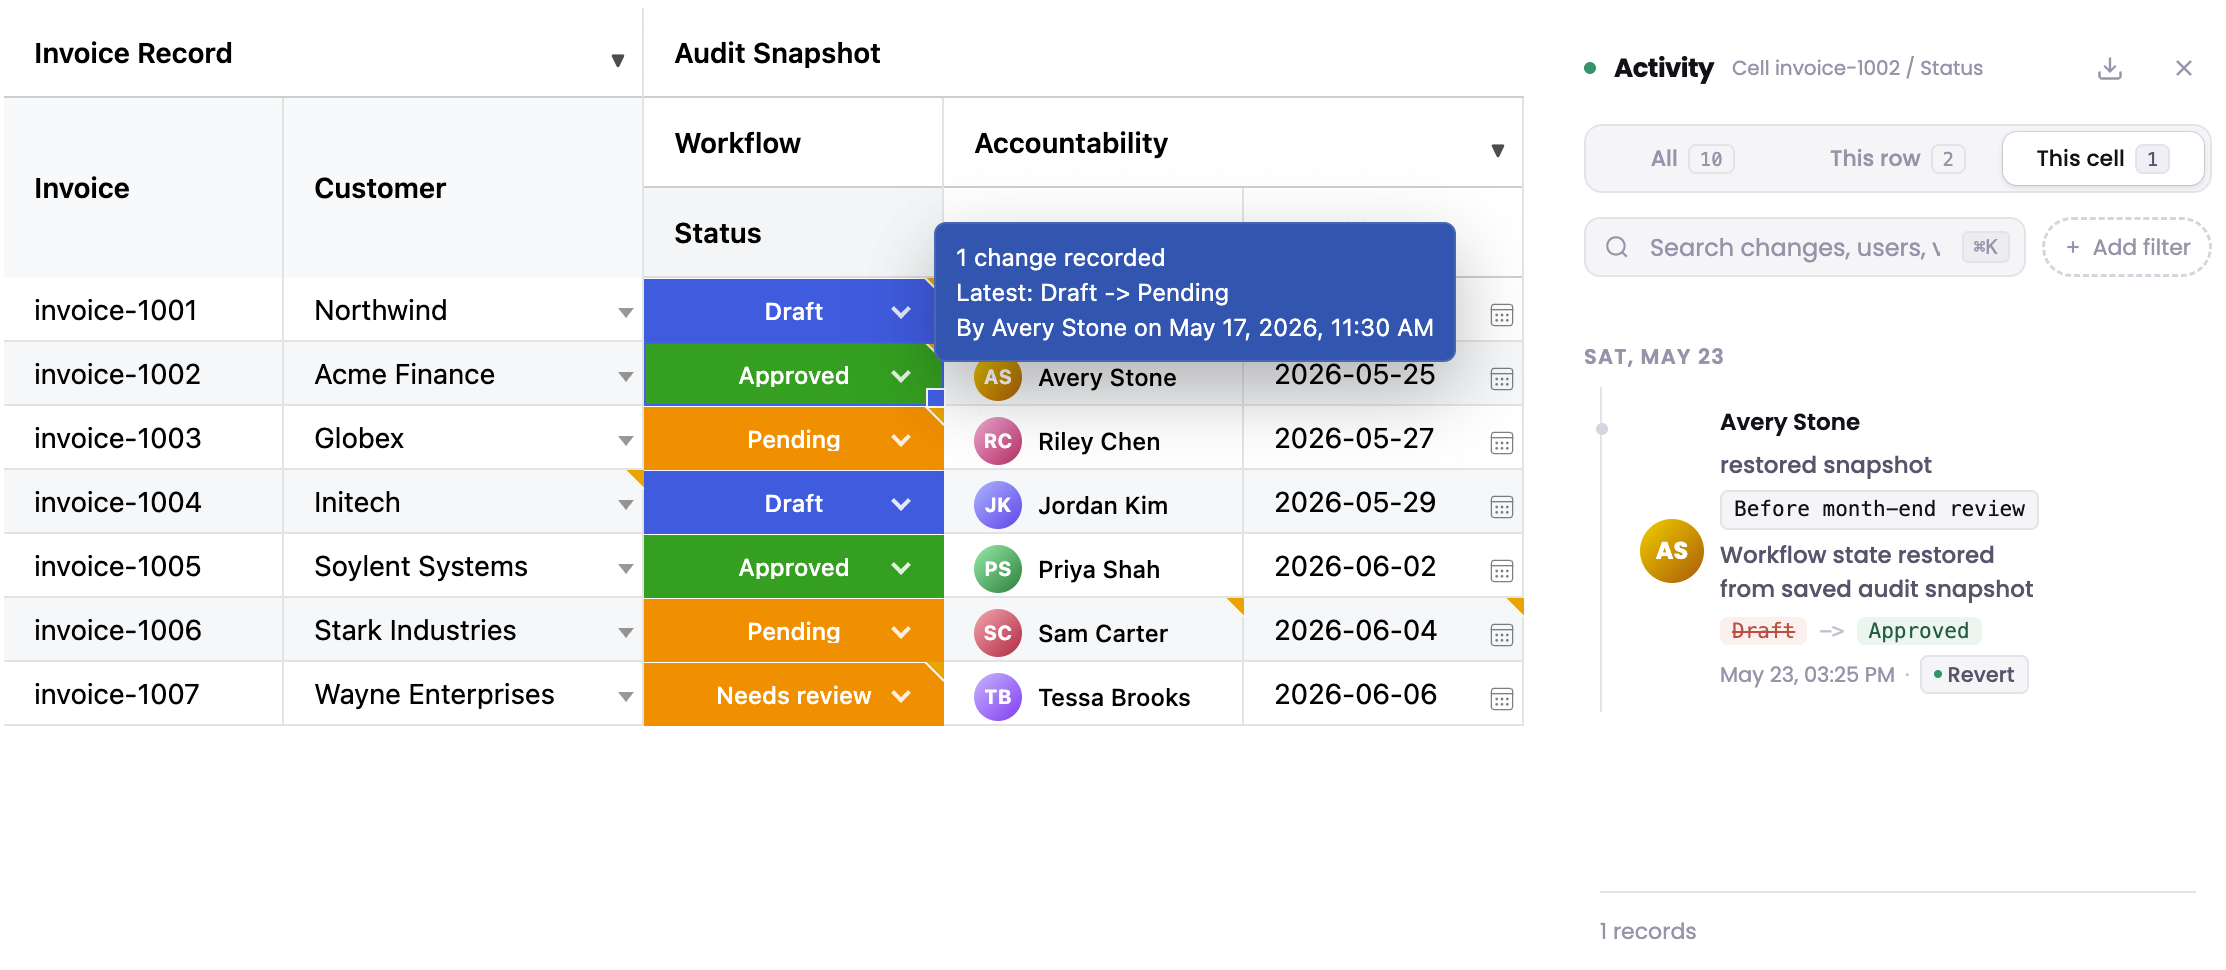
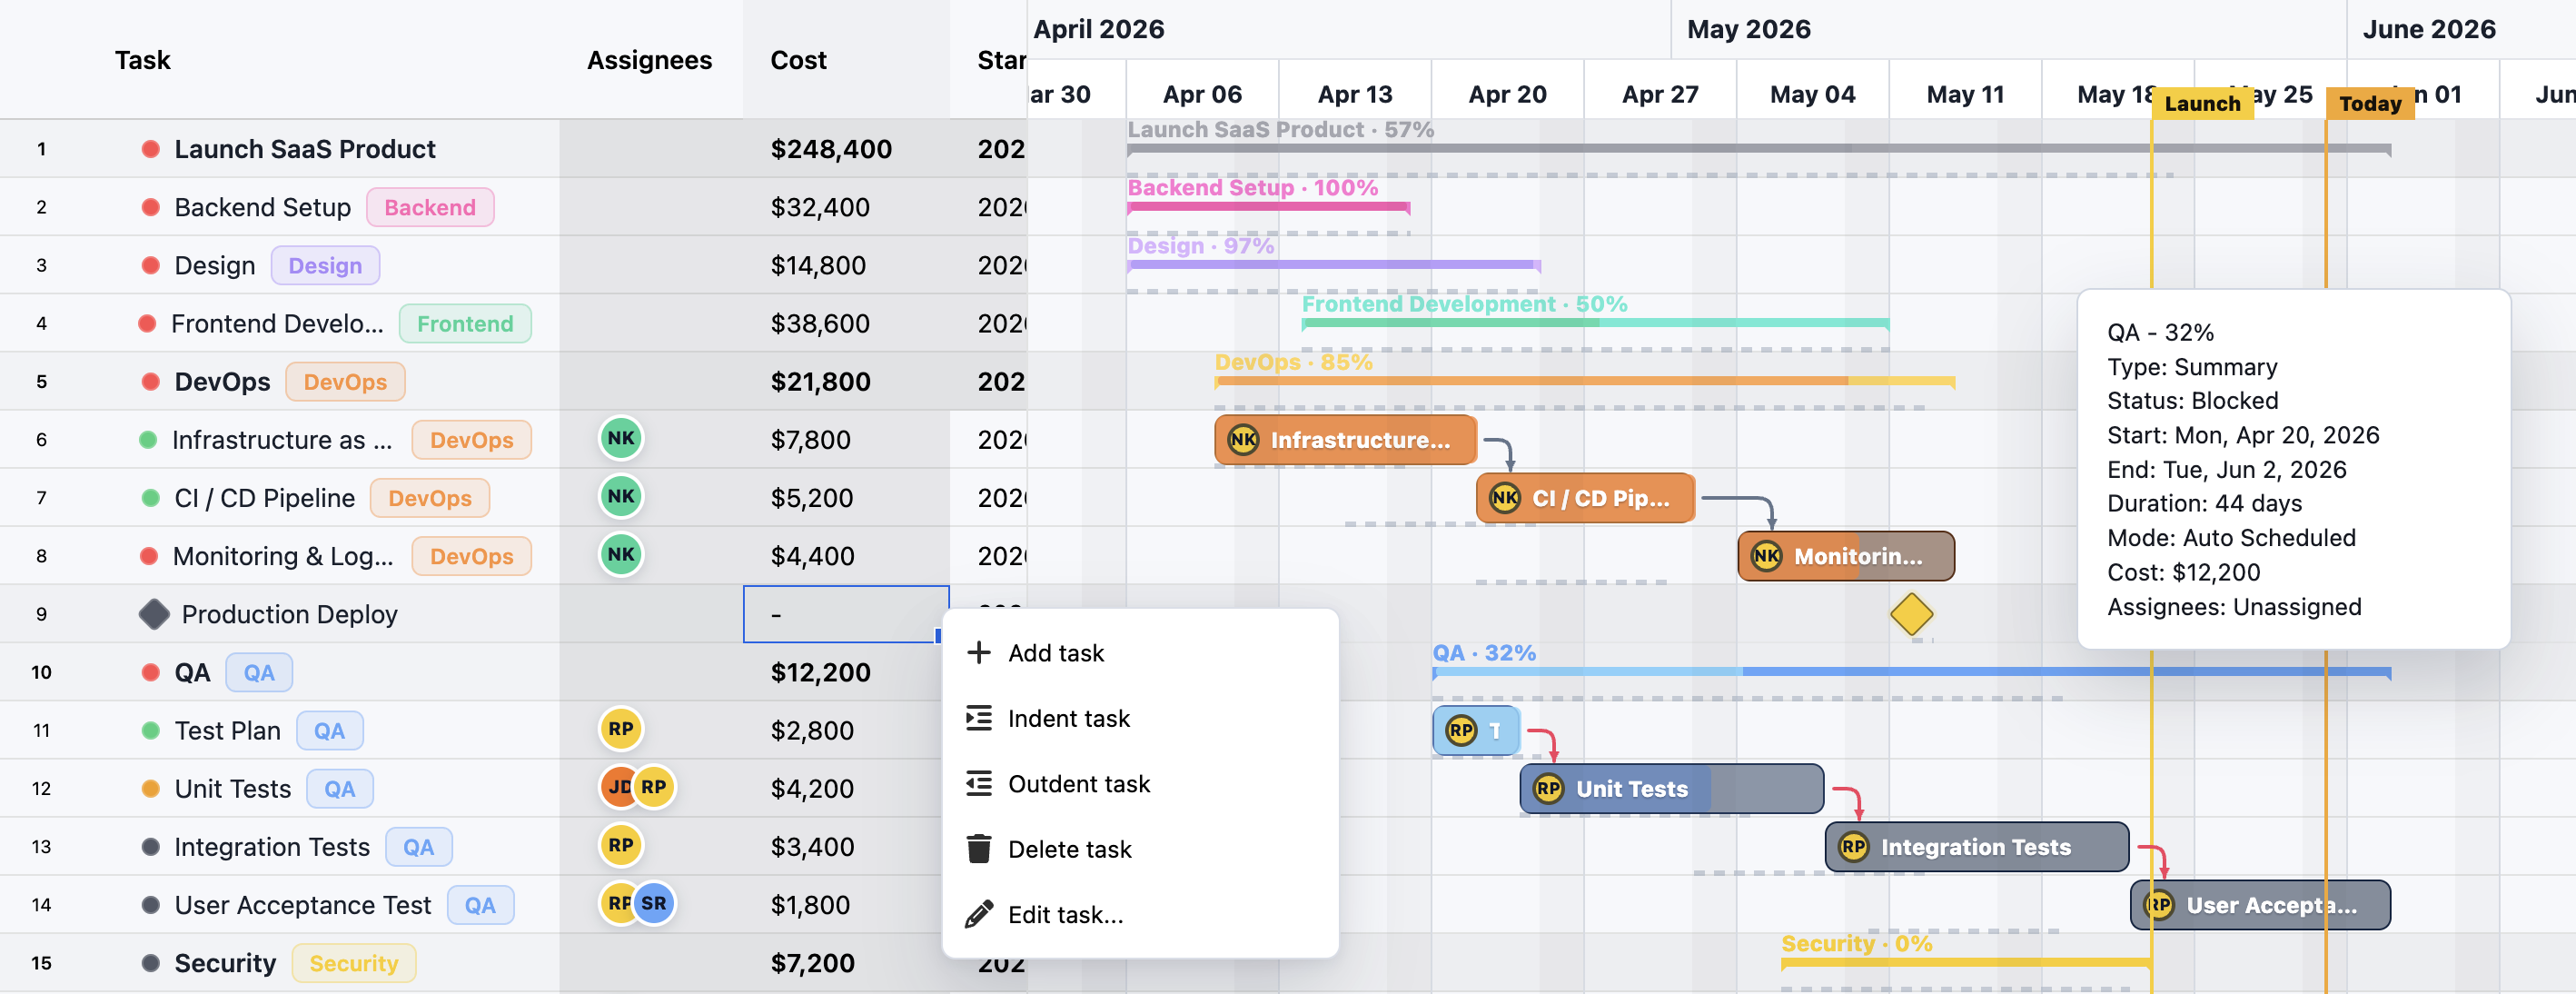
Spreadsheet power - inside your app.
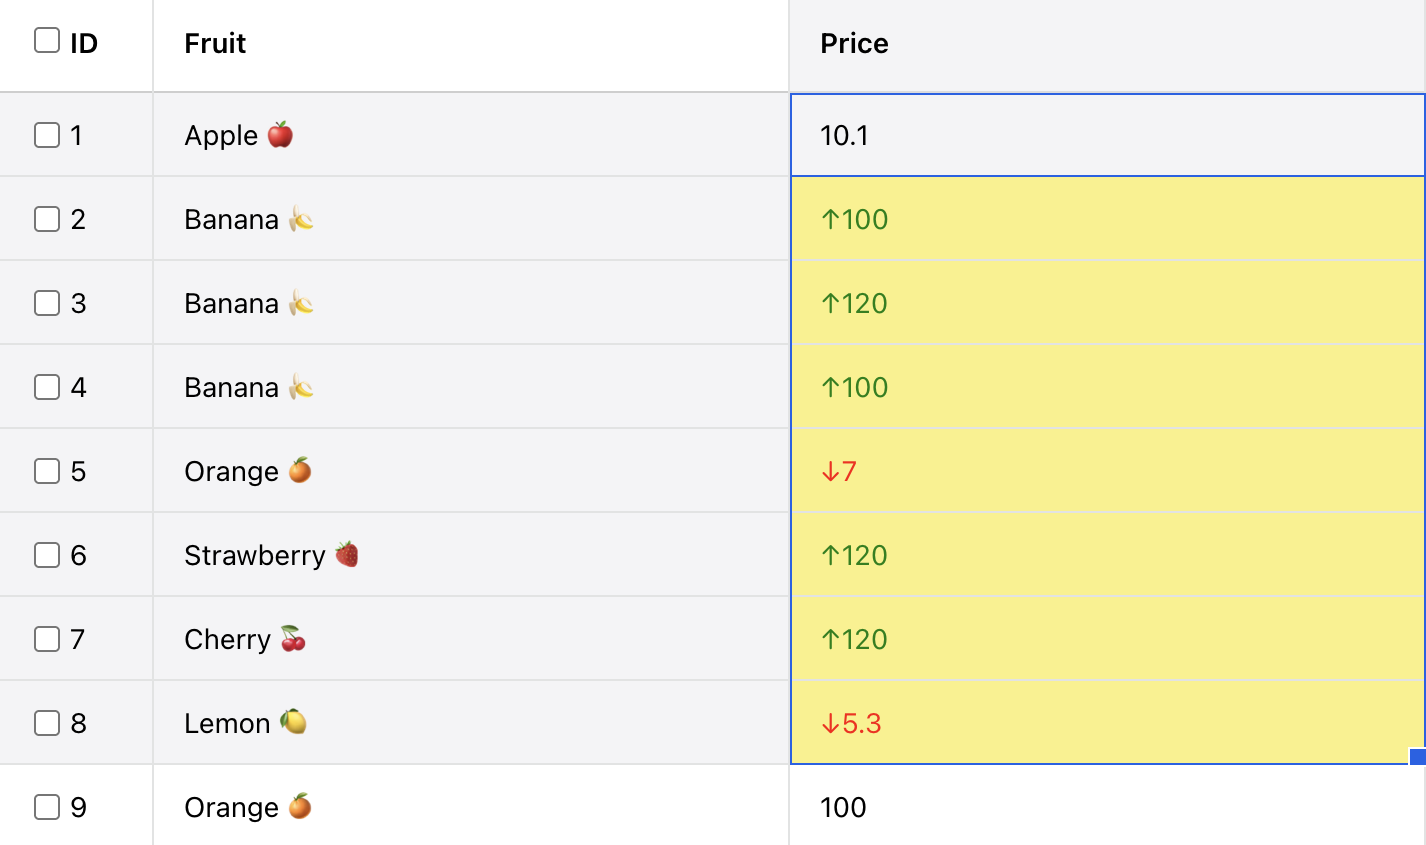
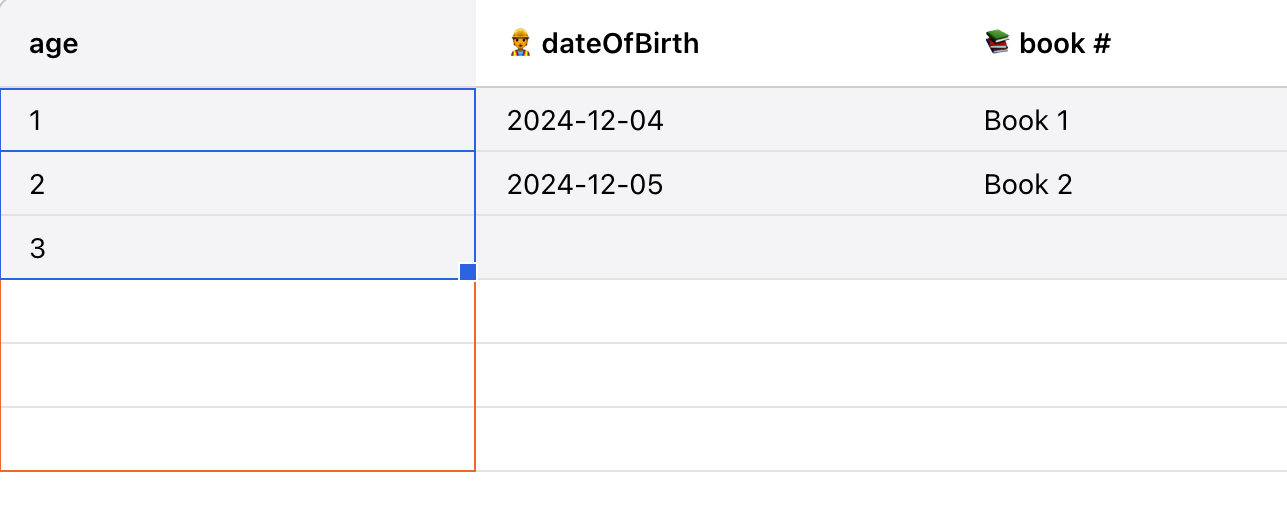
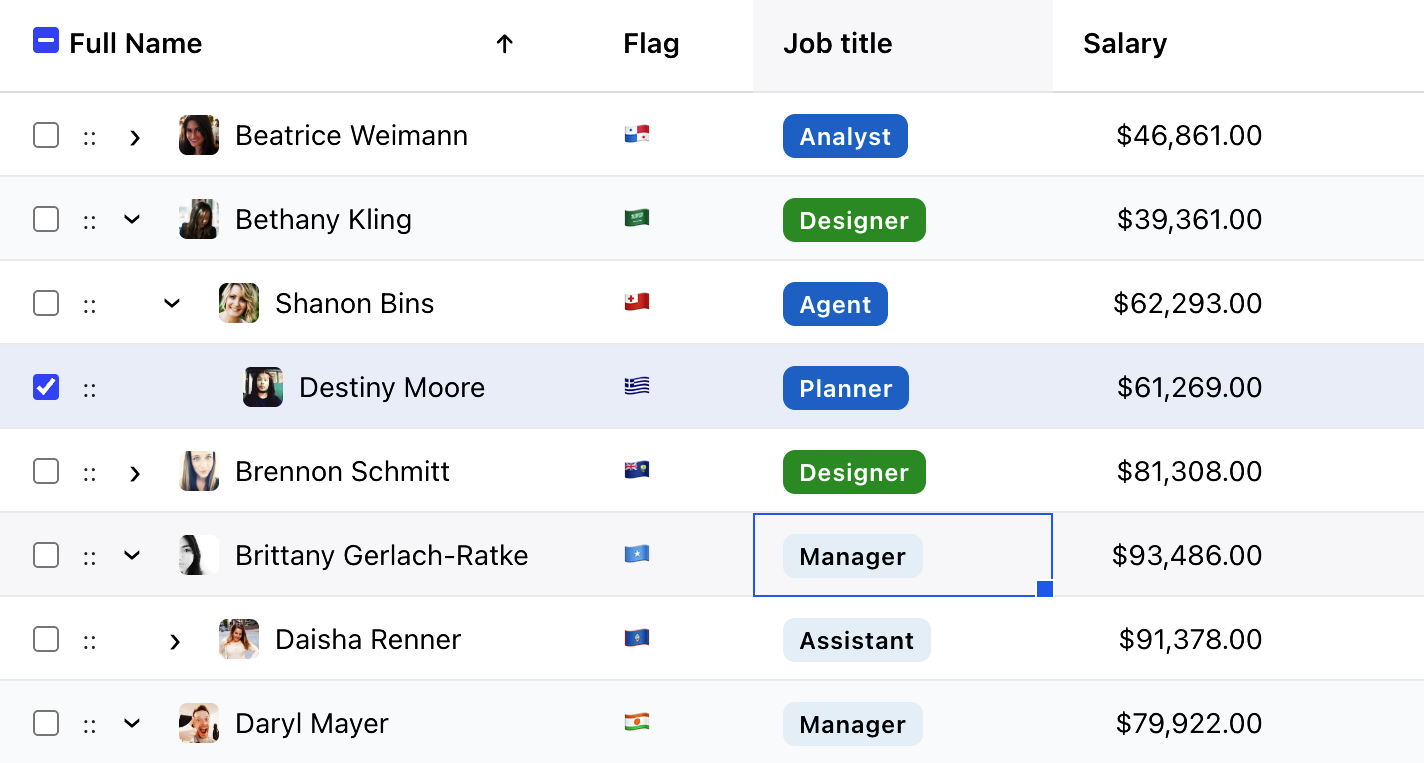
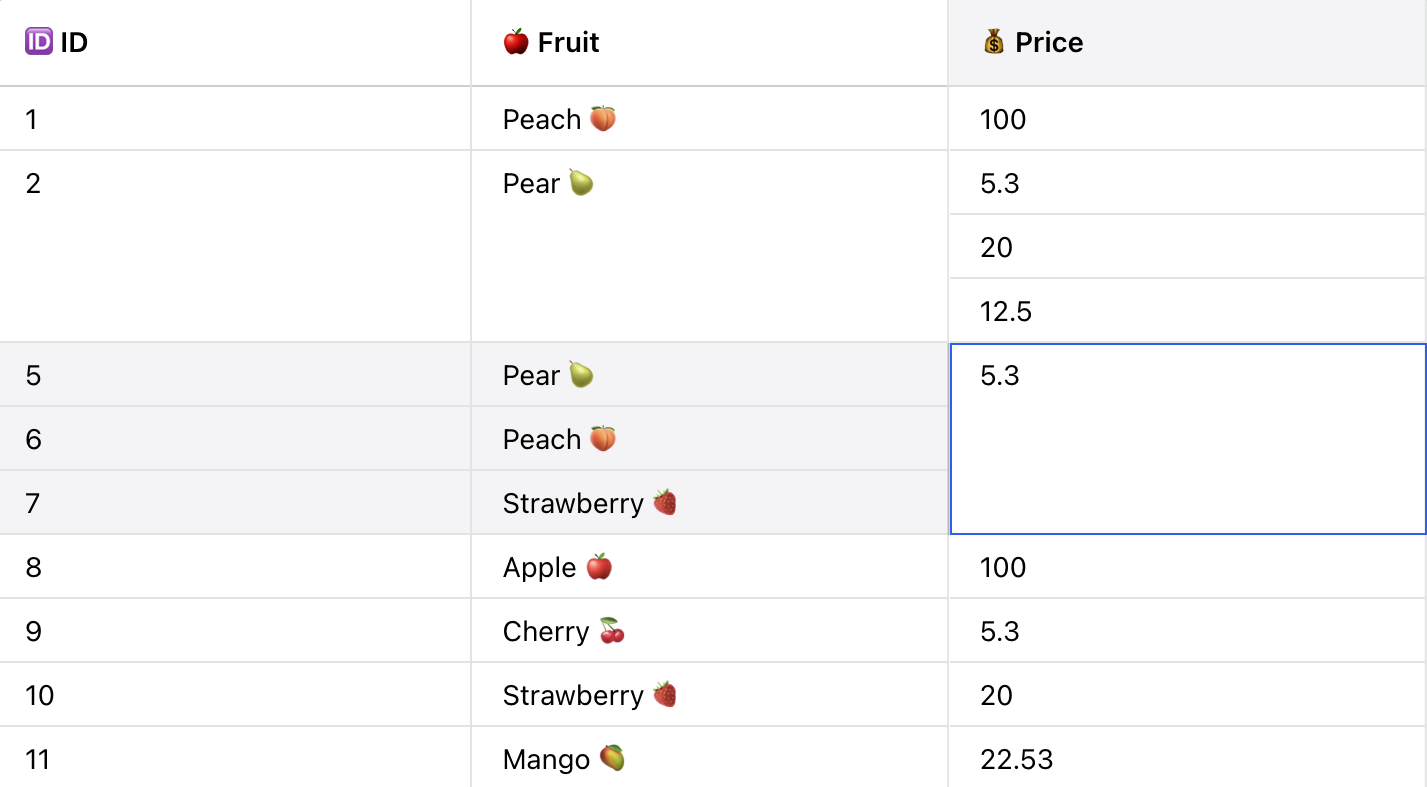
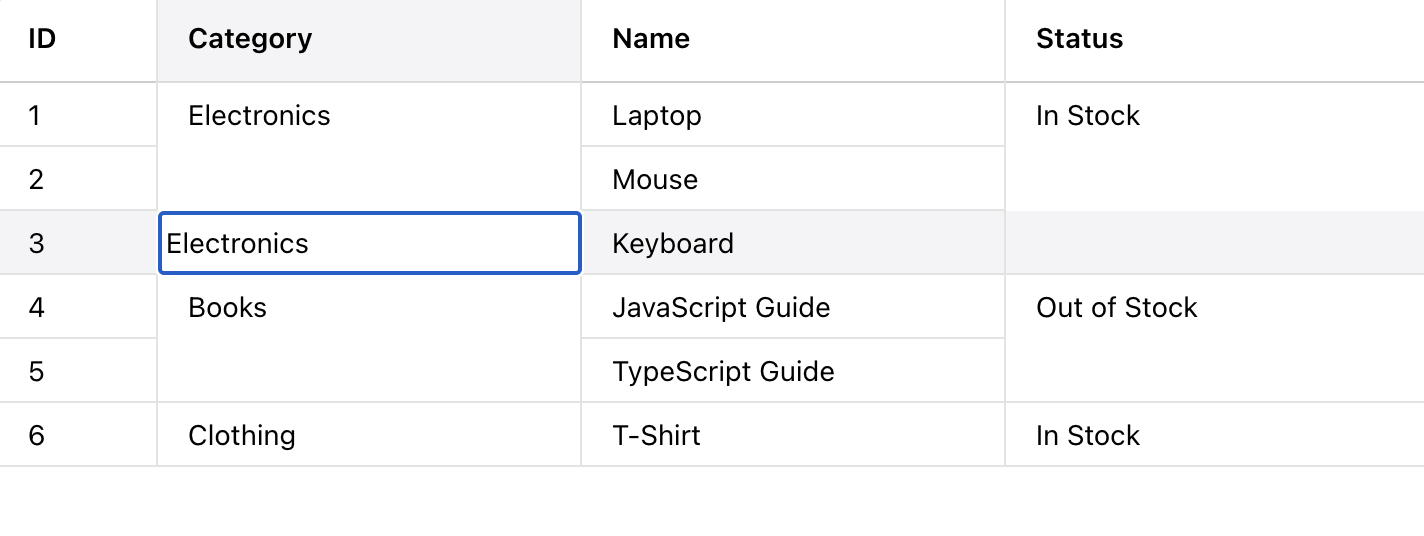
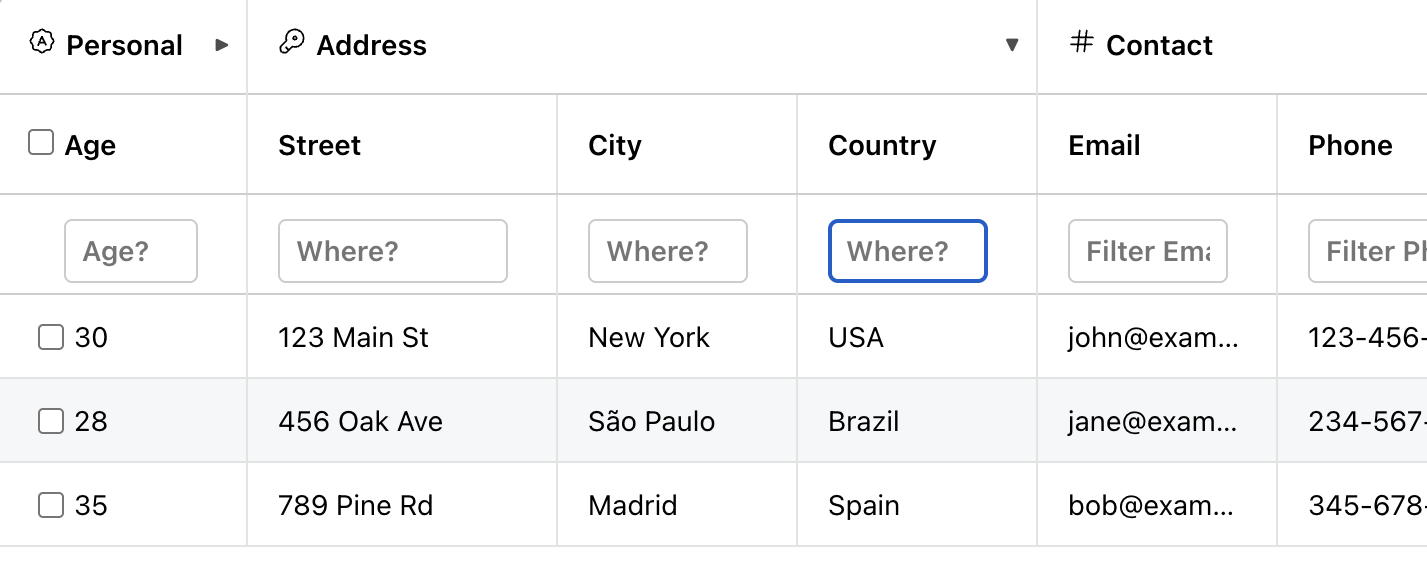
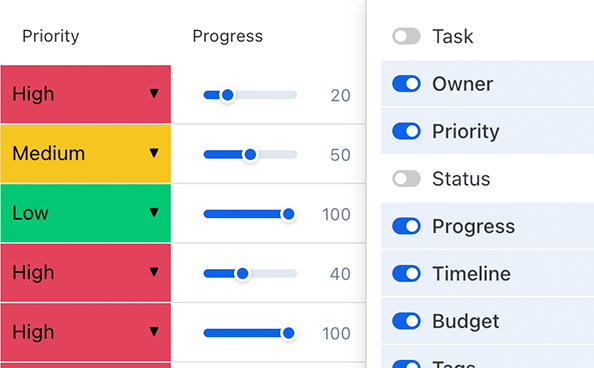
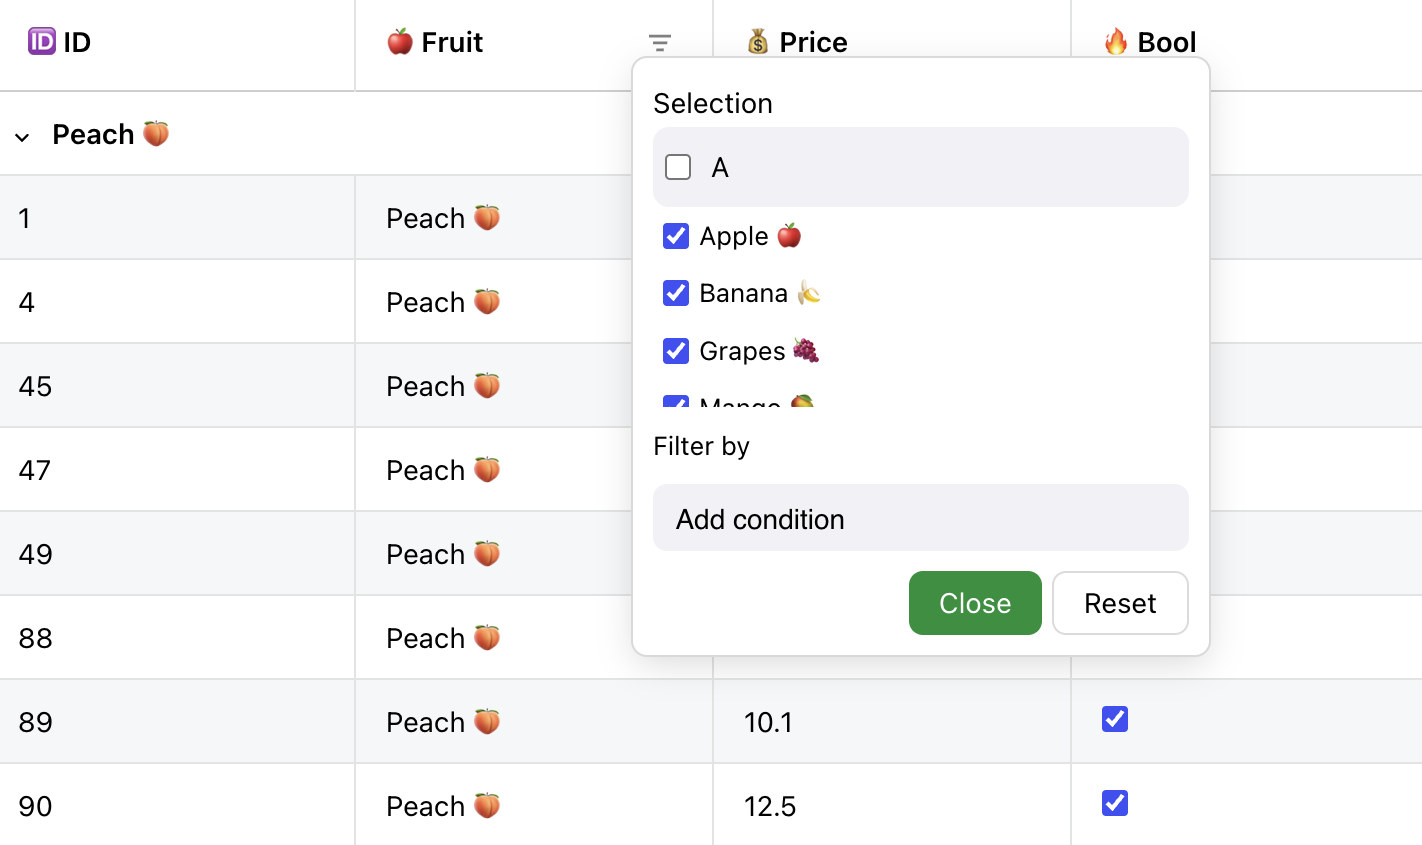
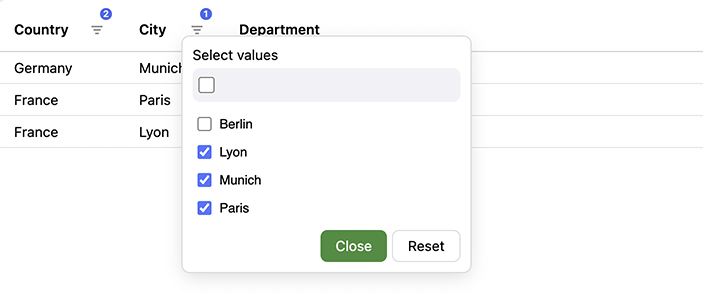
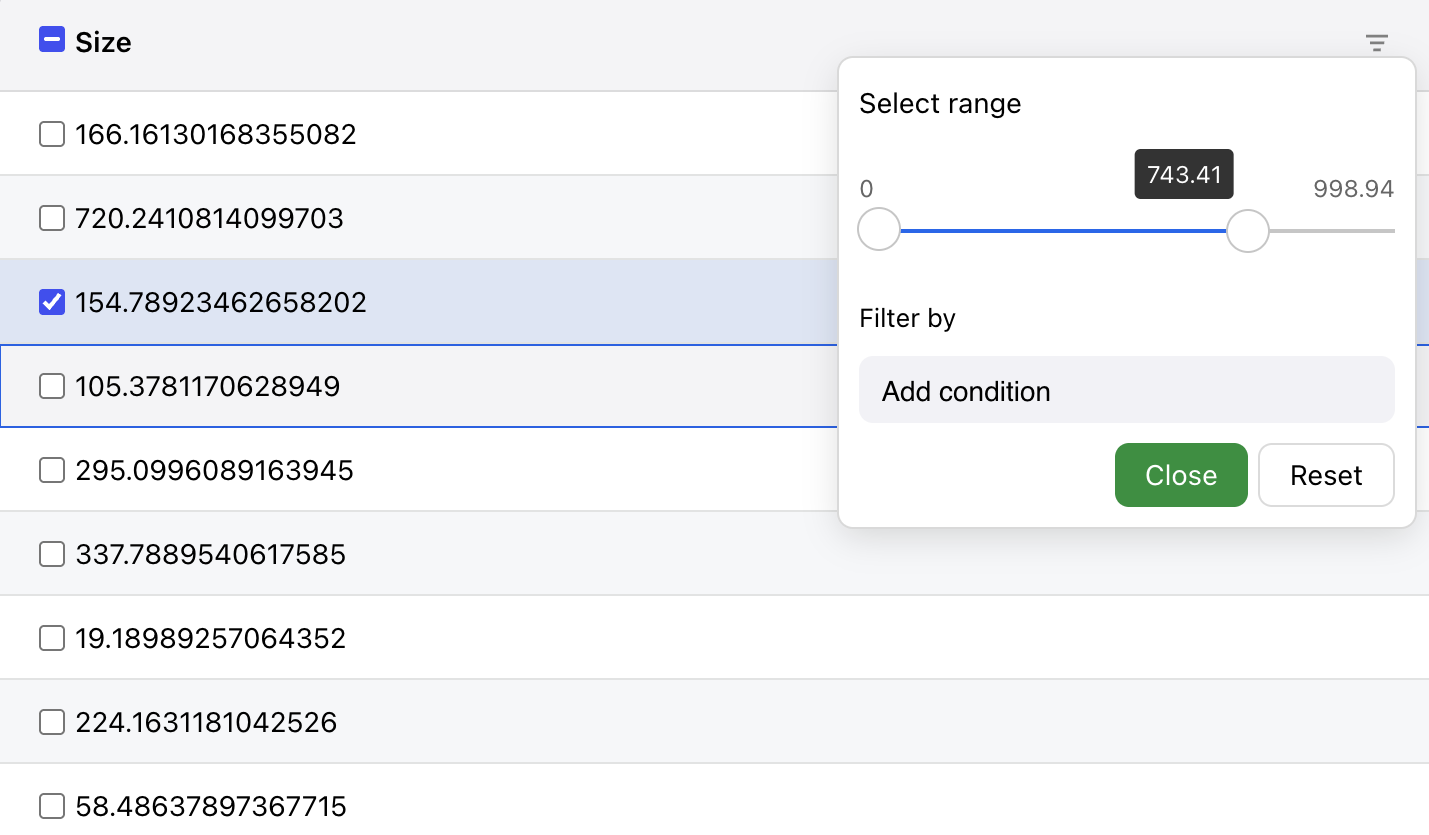
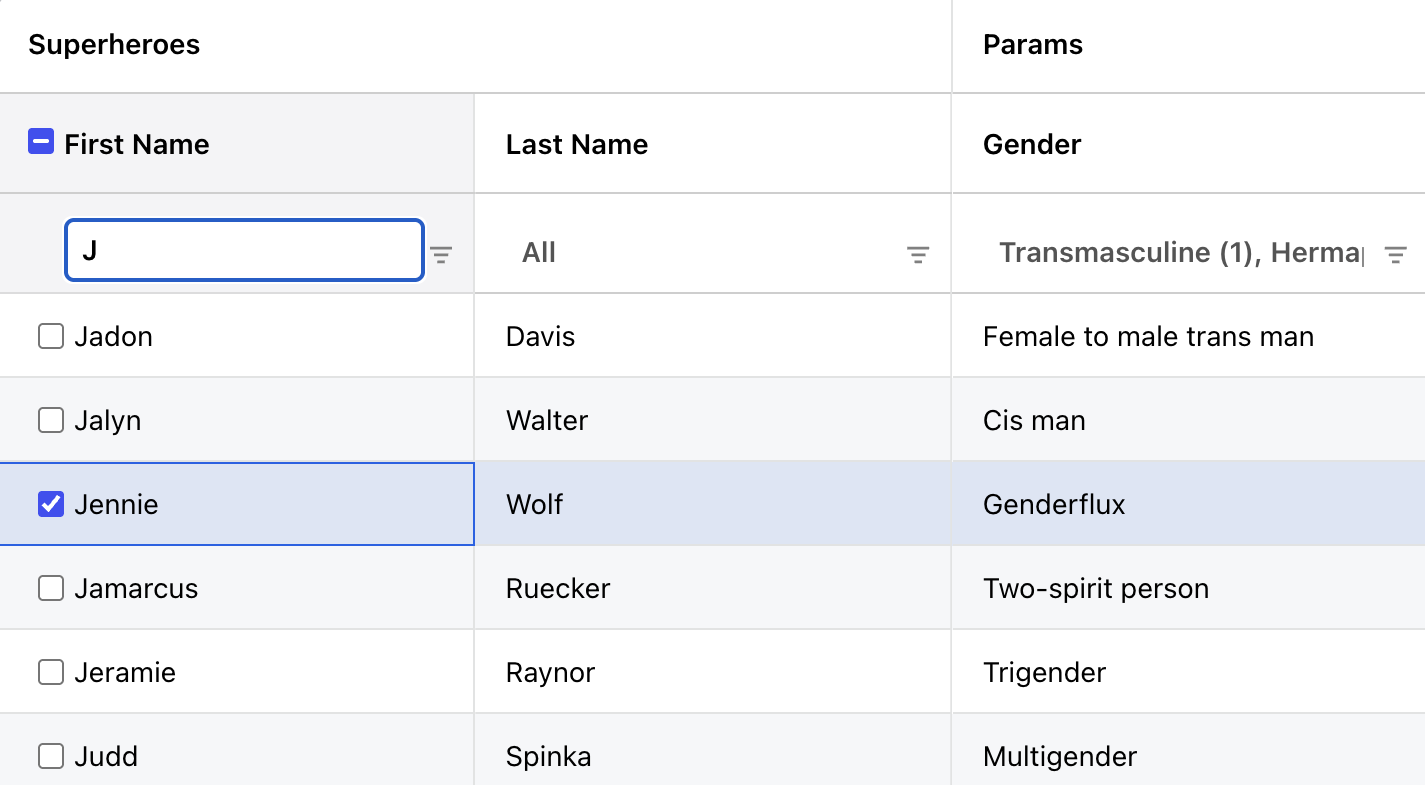
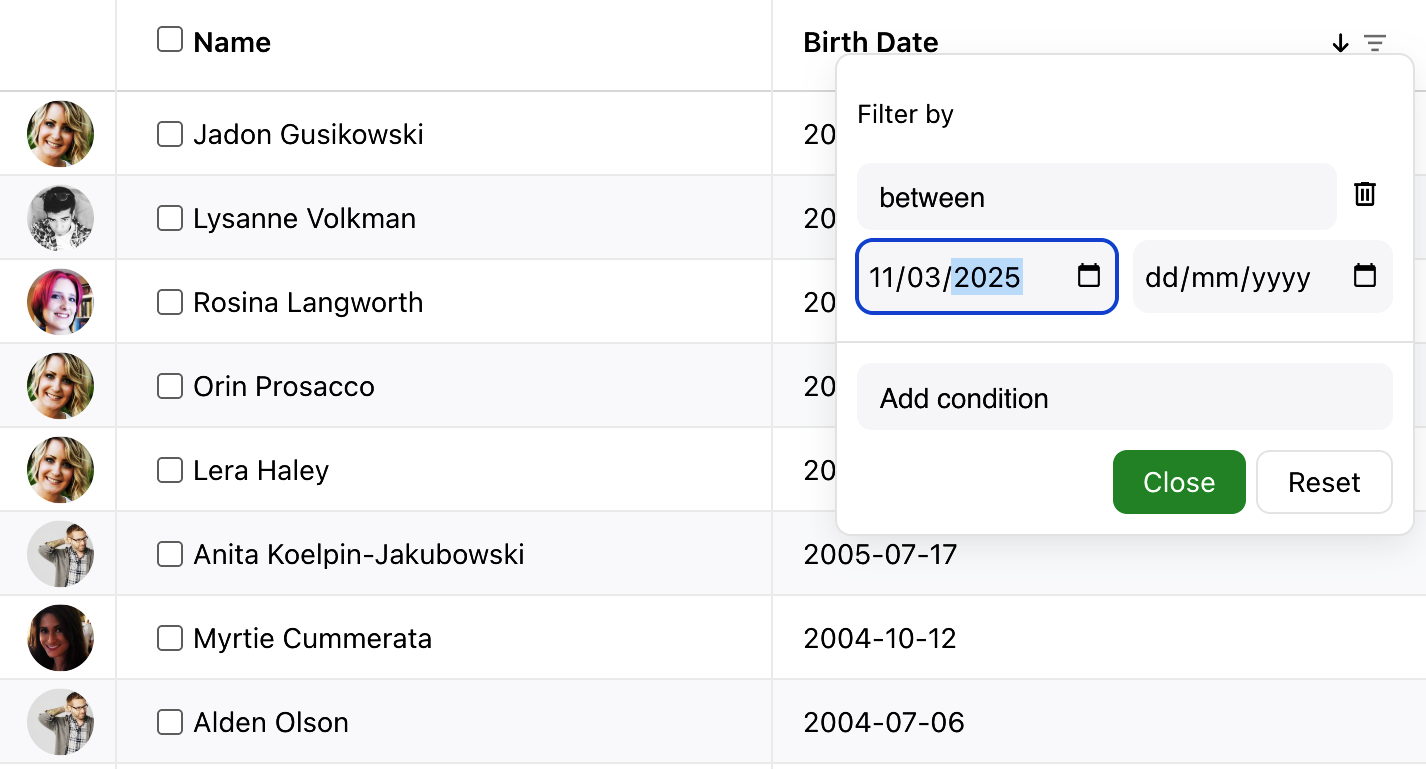
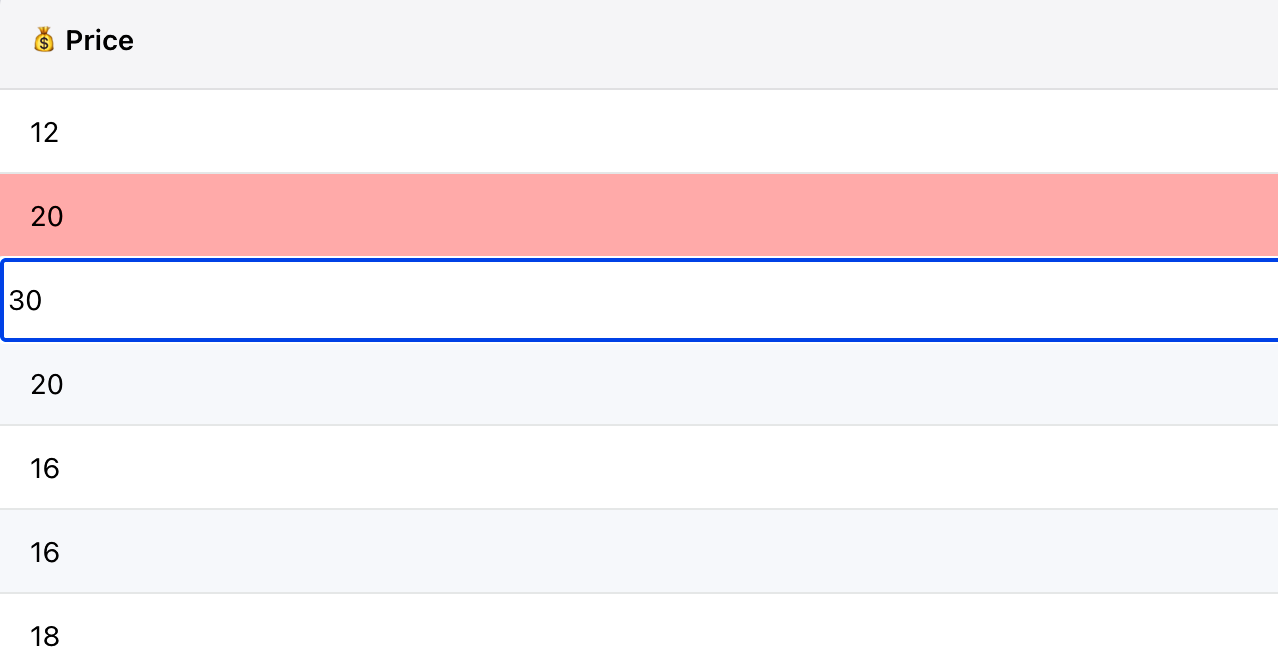
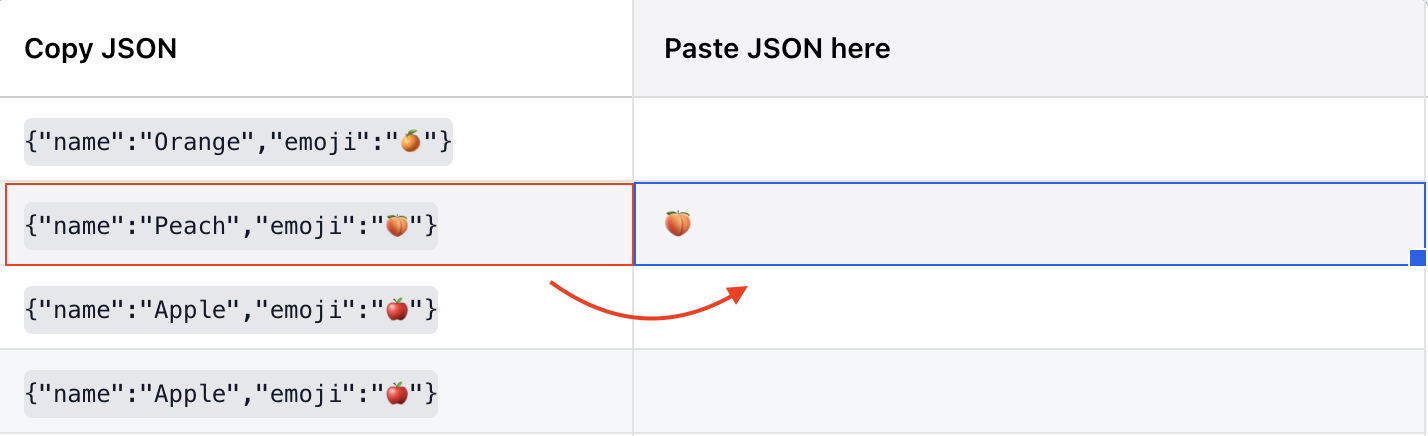
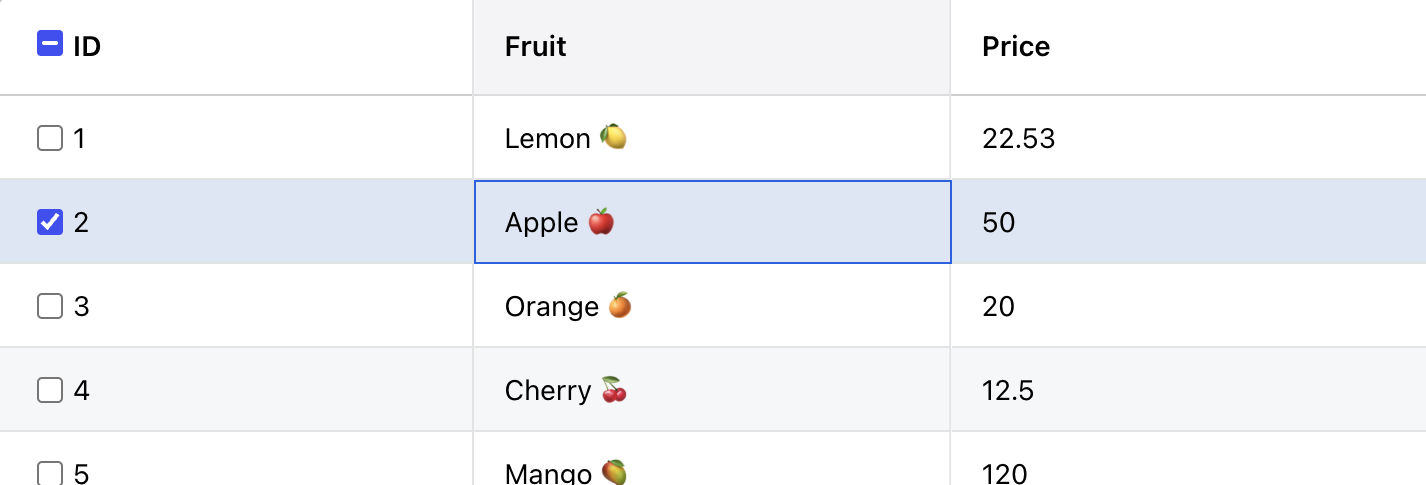
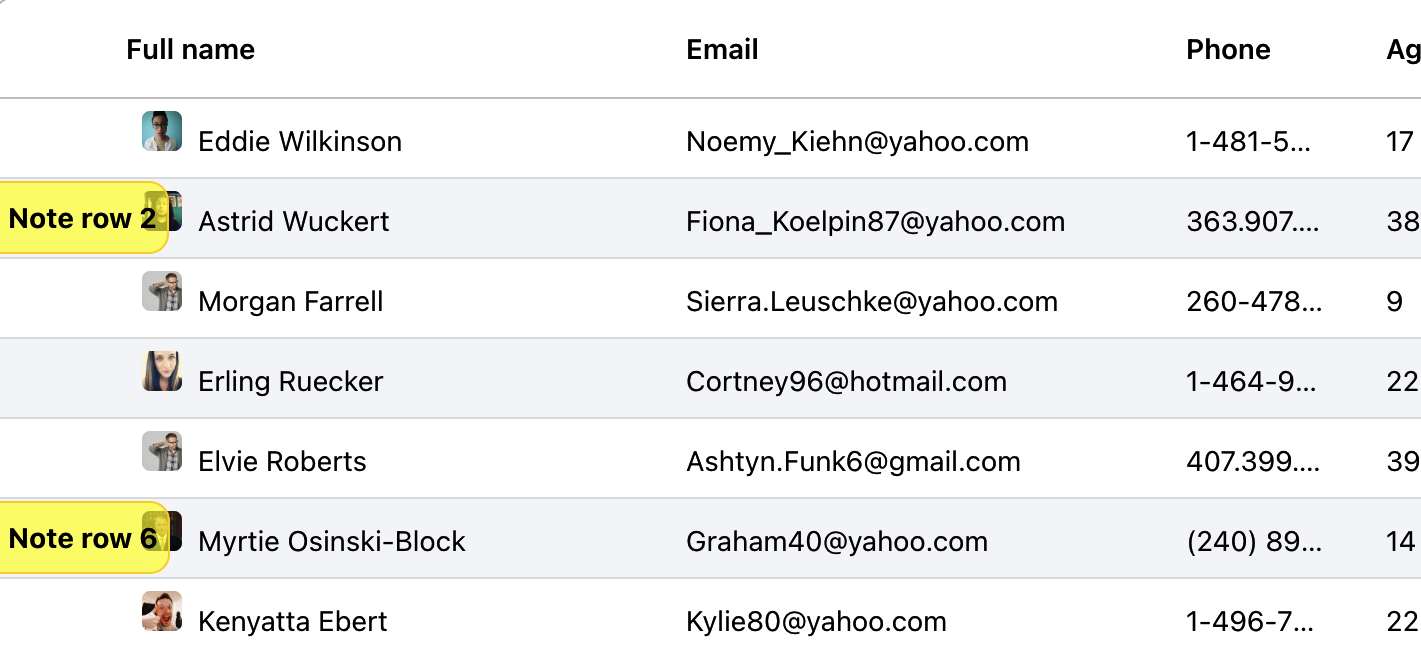
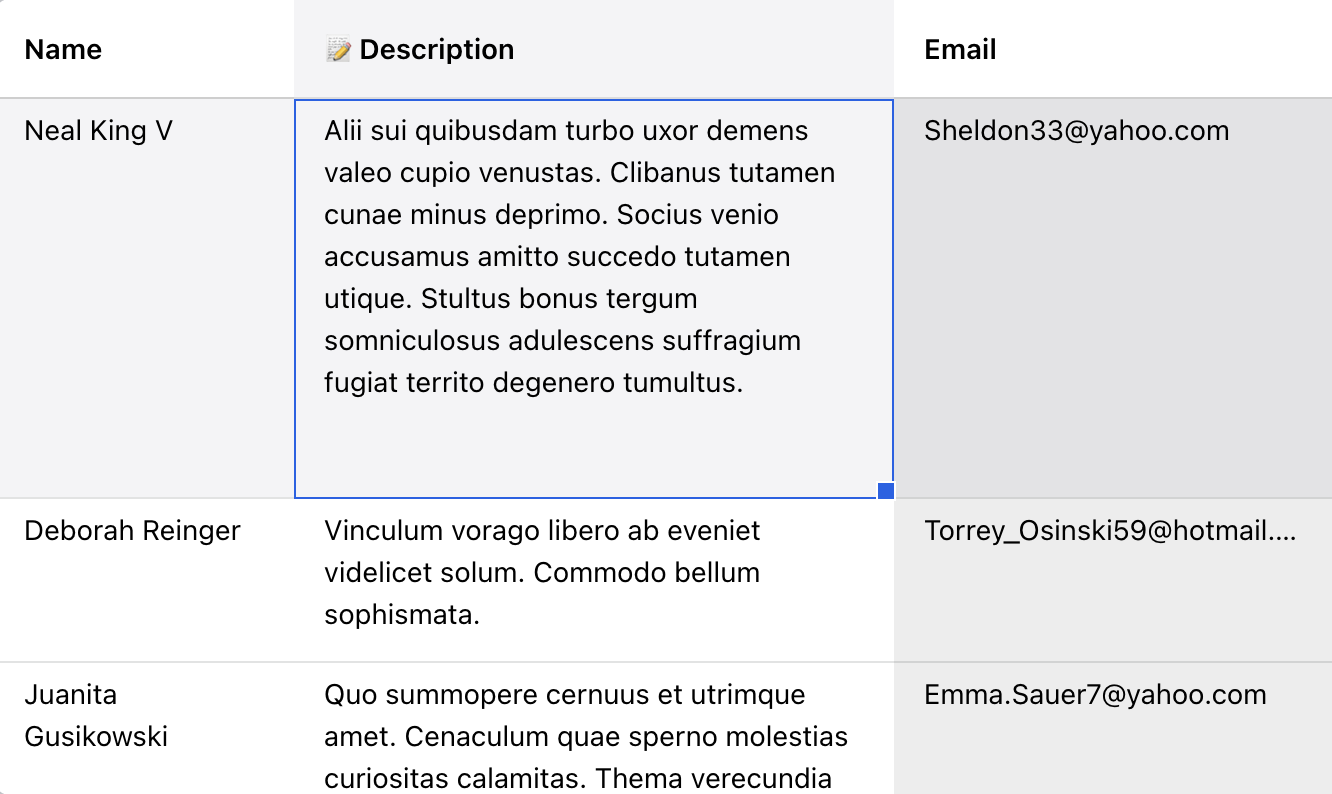
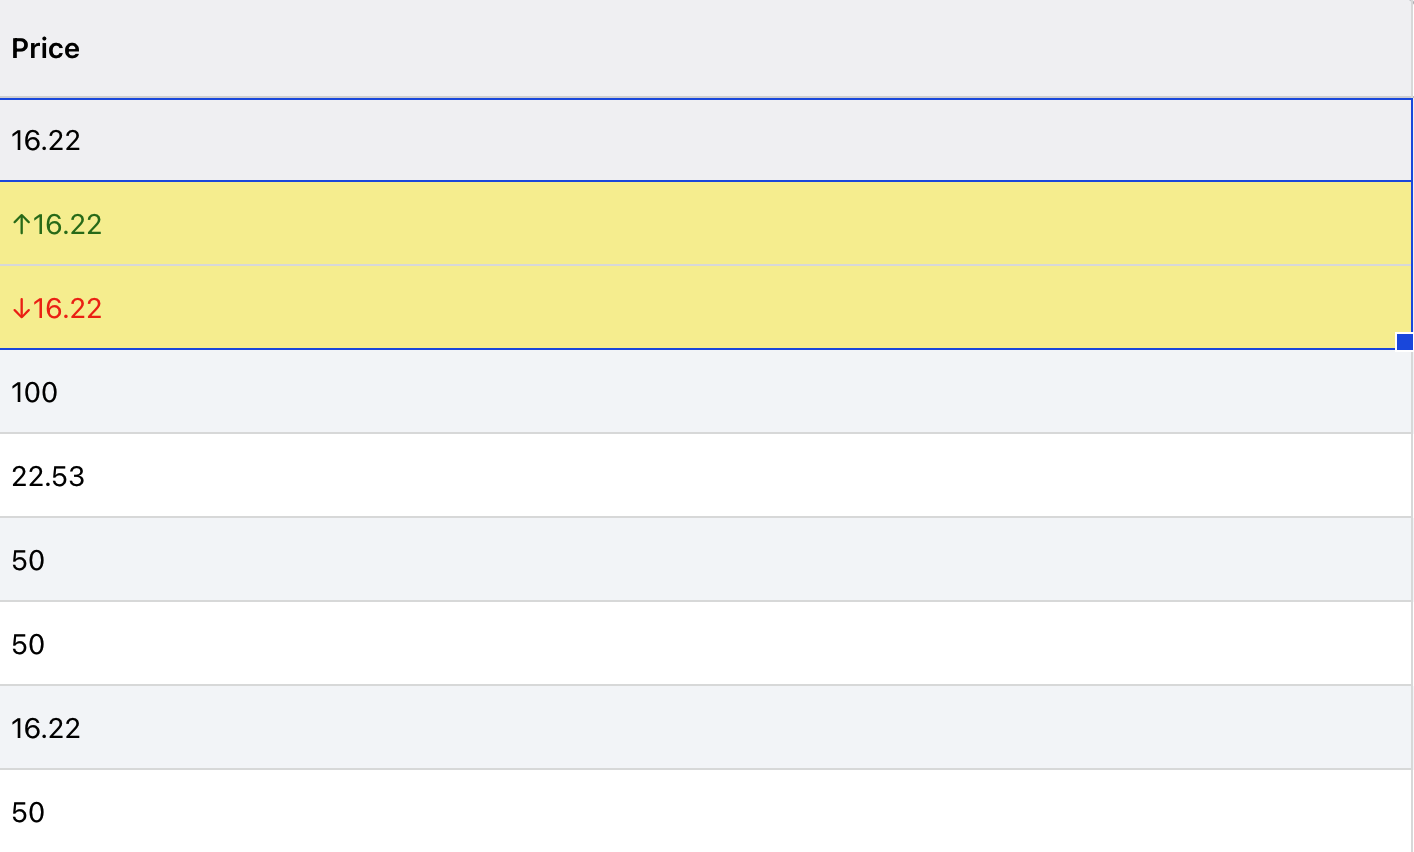
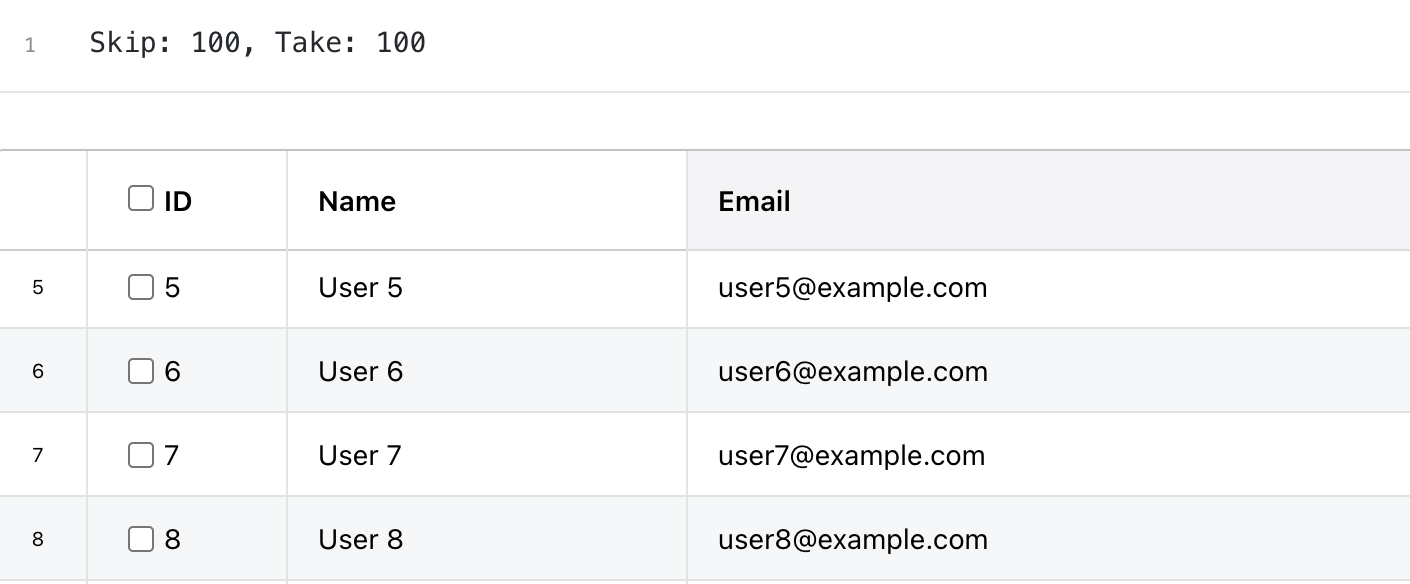
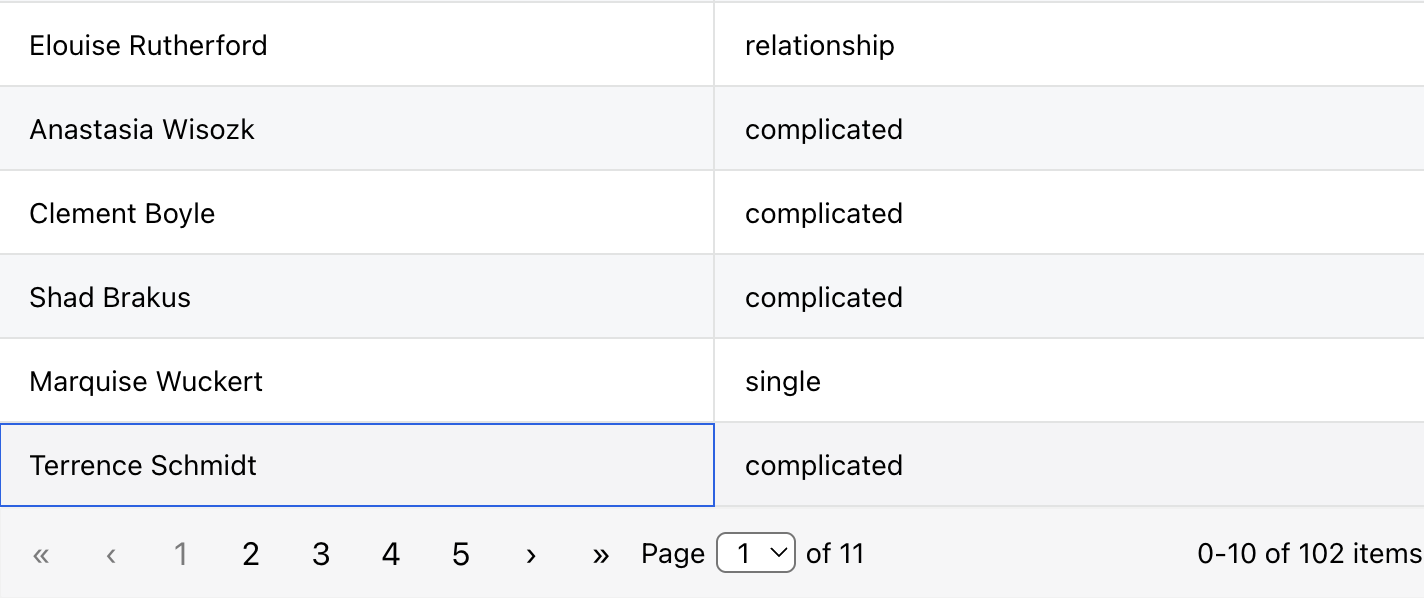
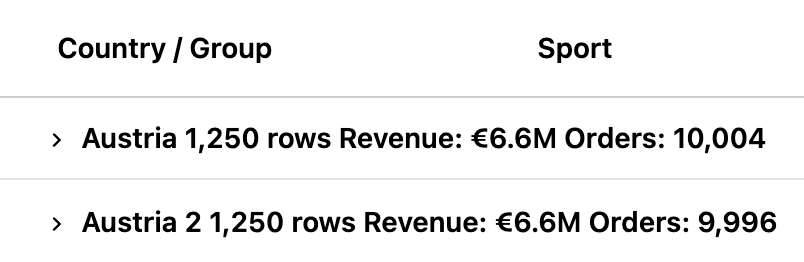
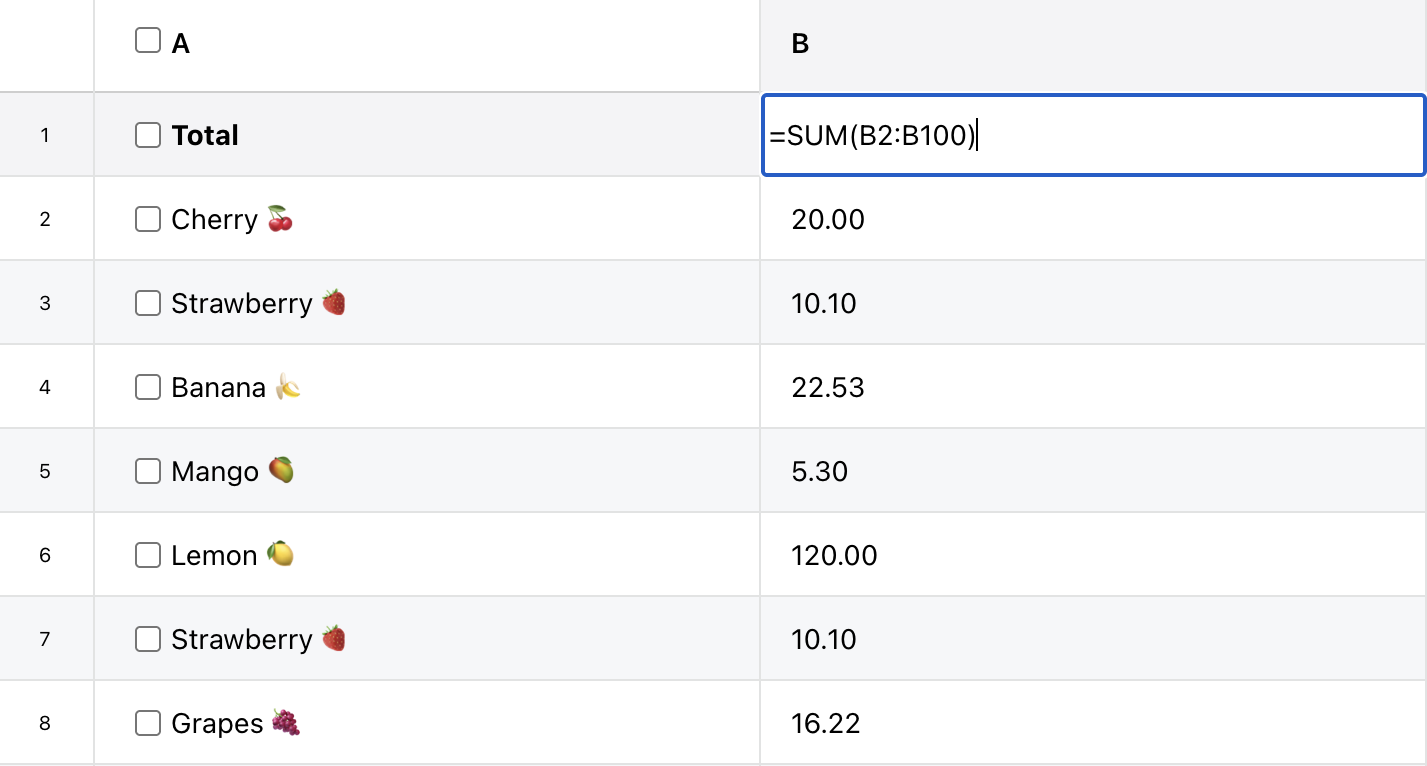
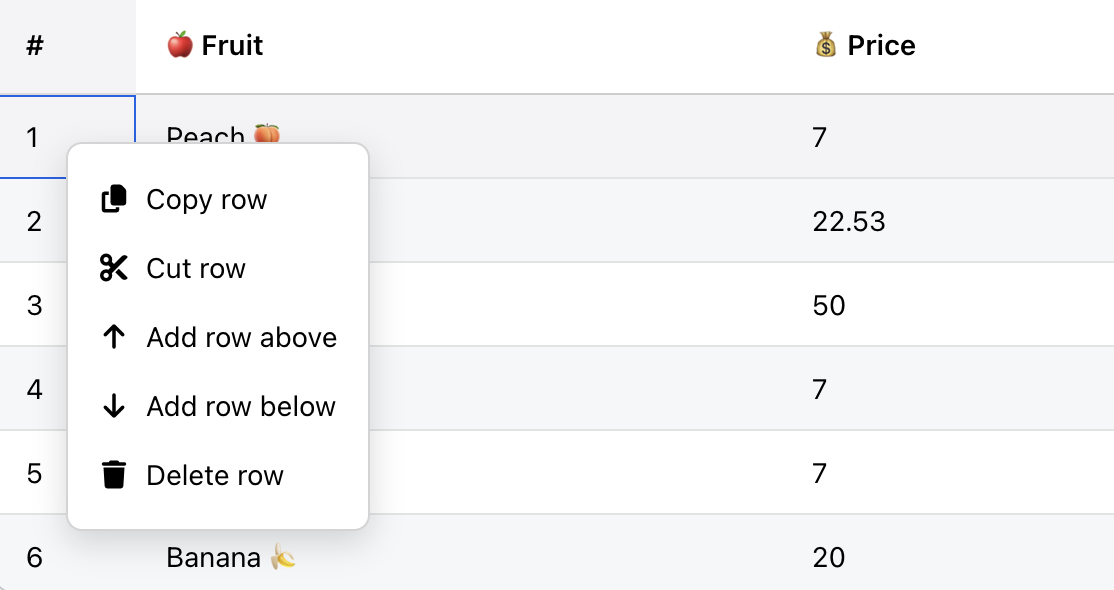
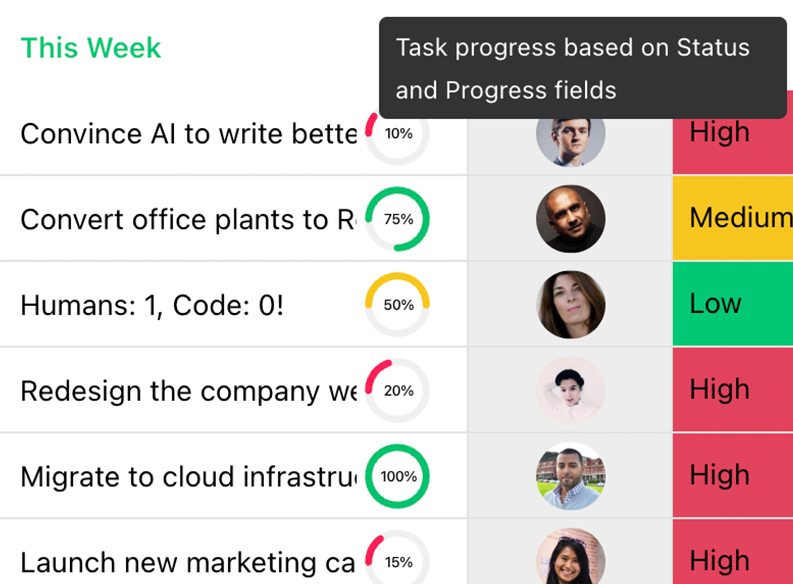
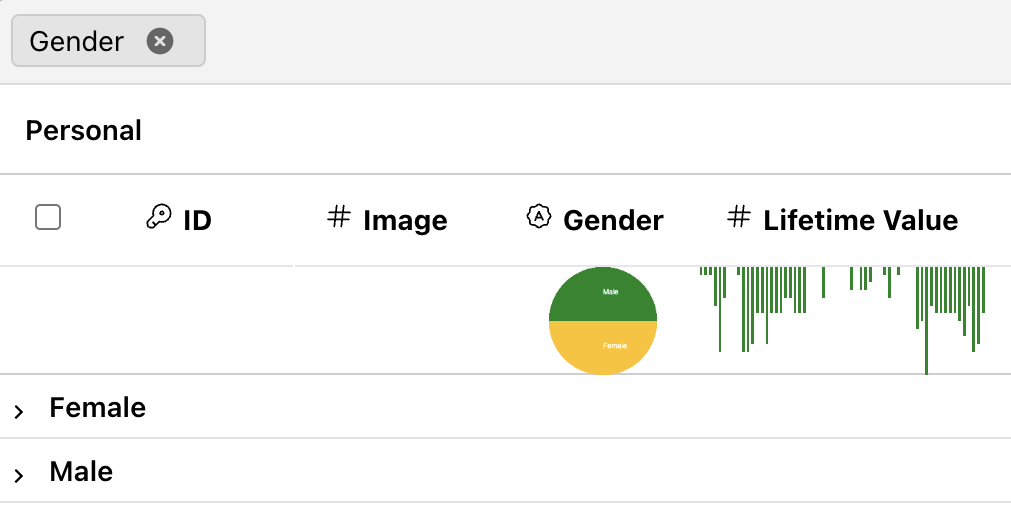
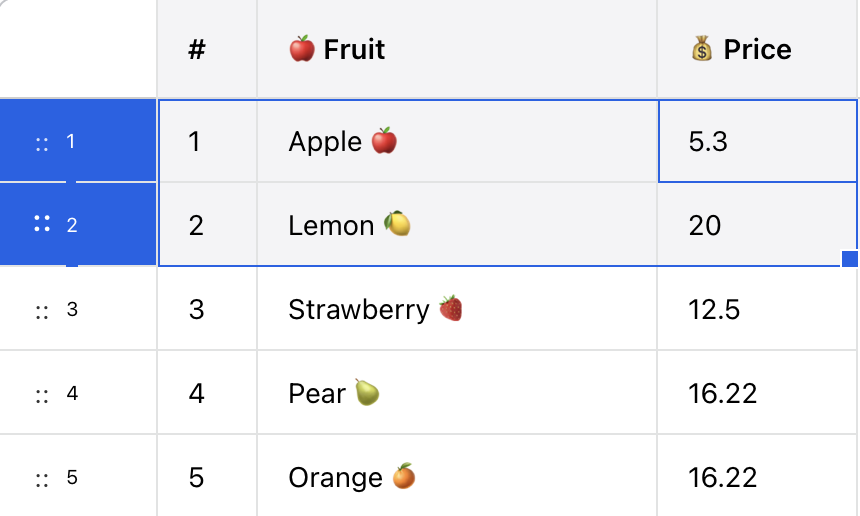
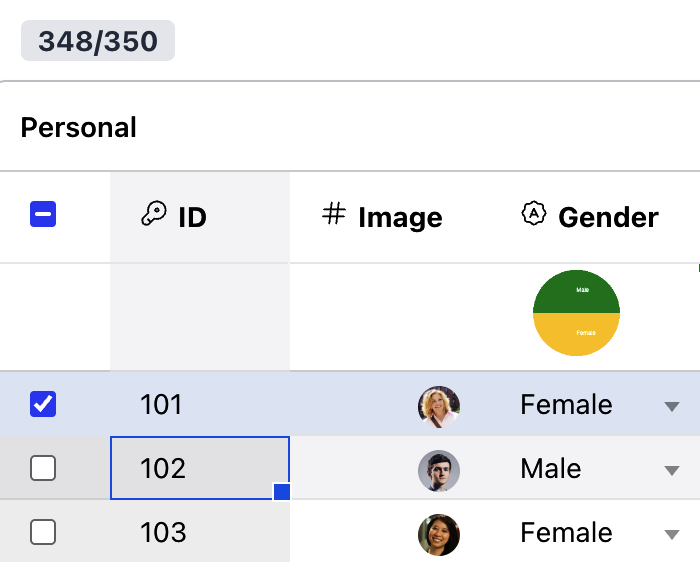
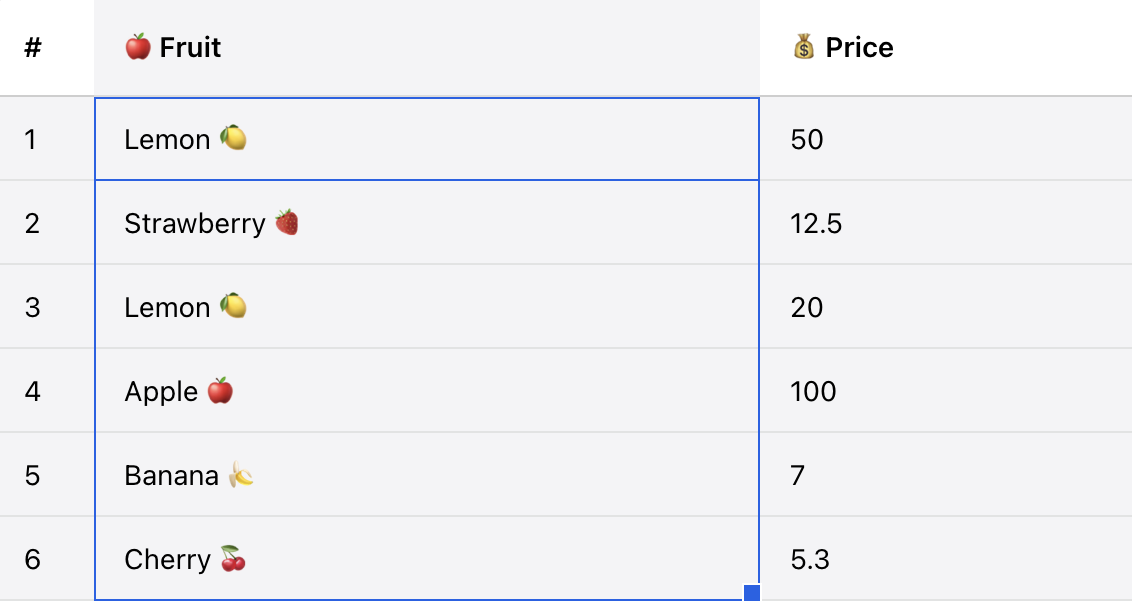
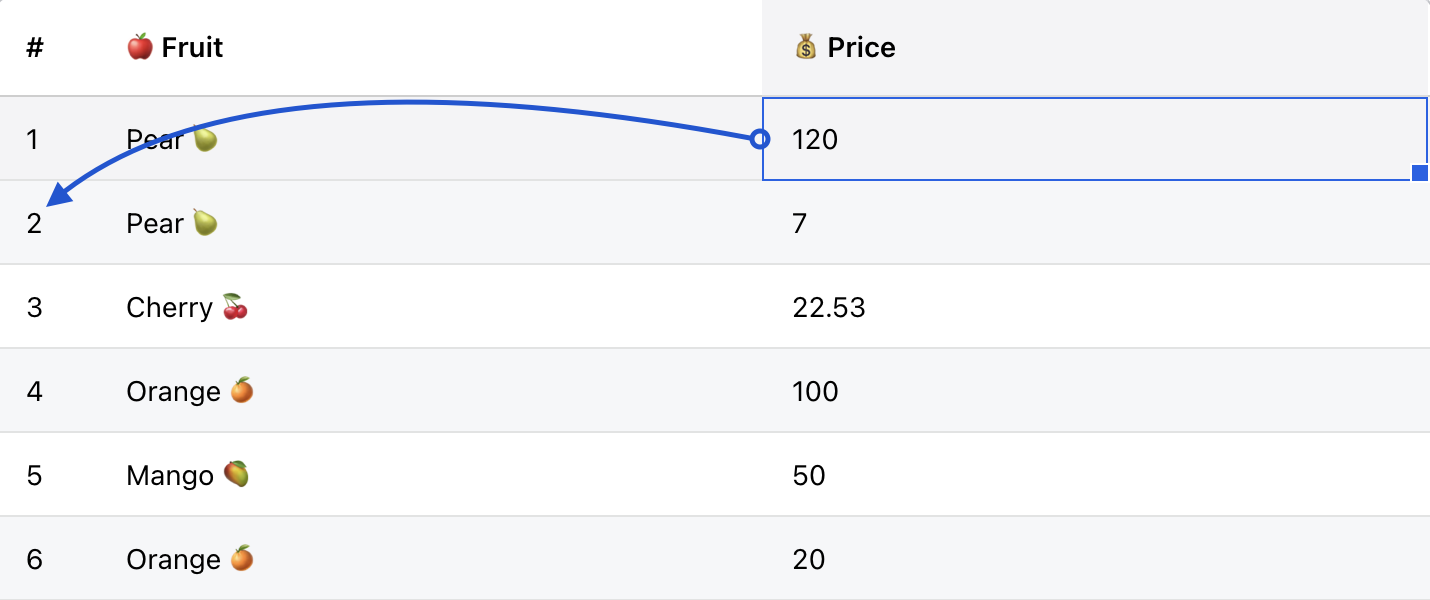
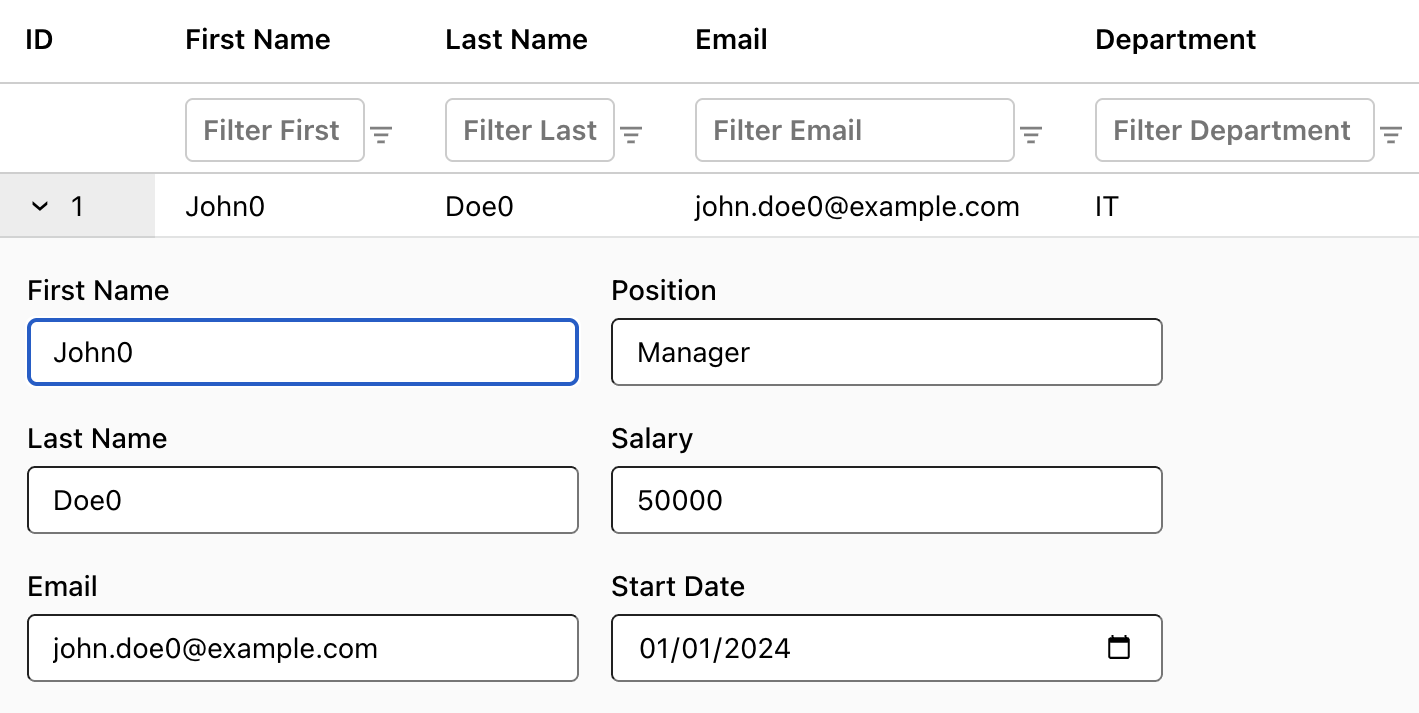
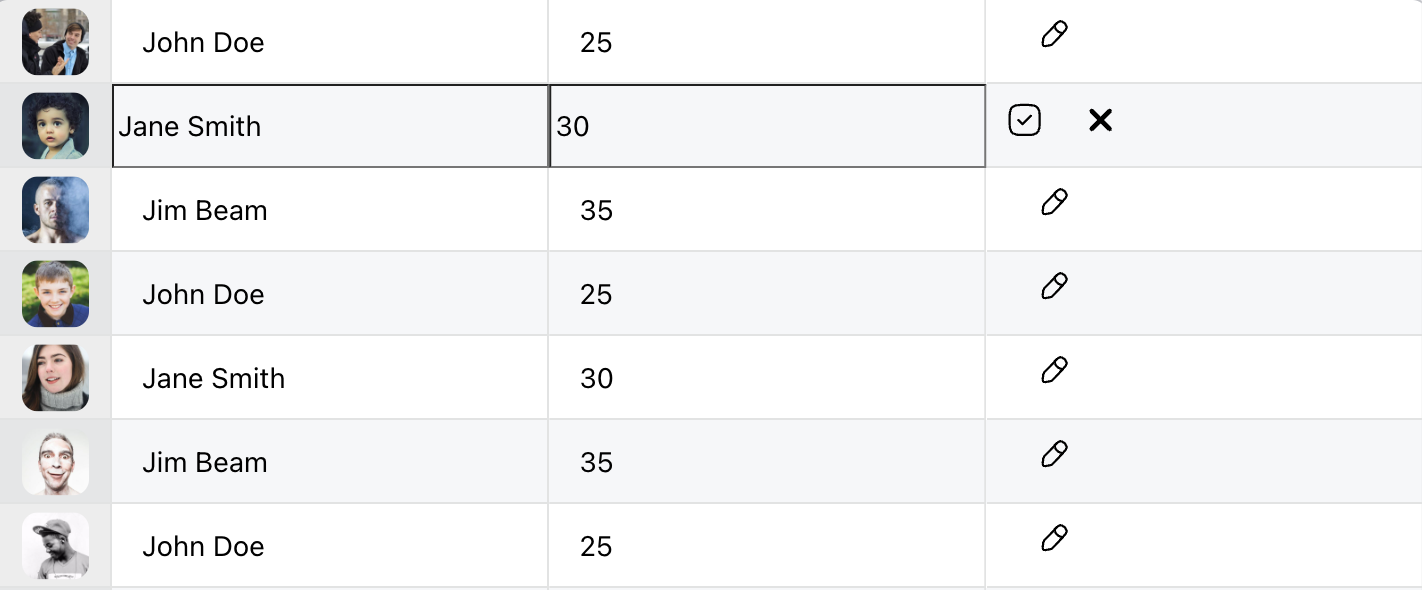
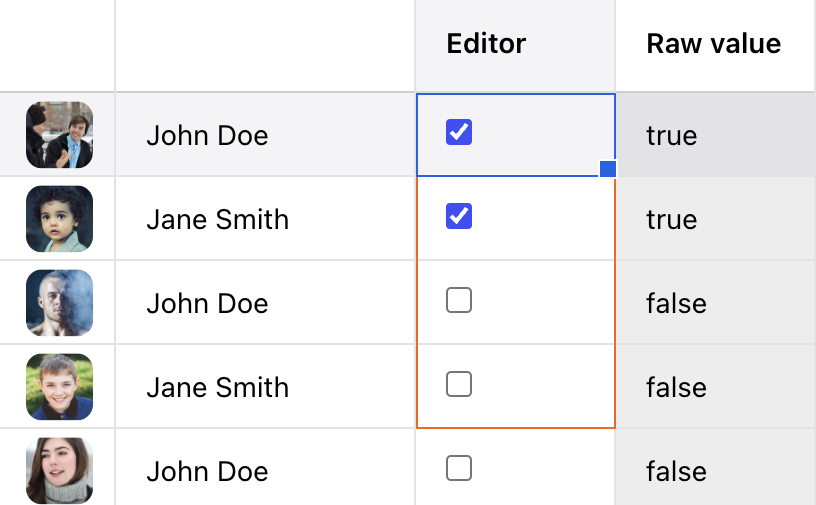
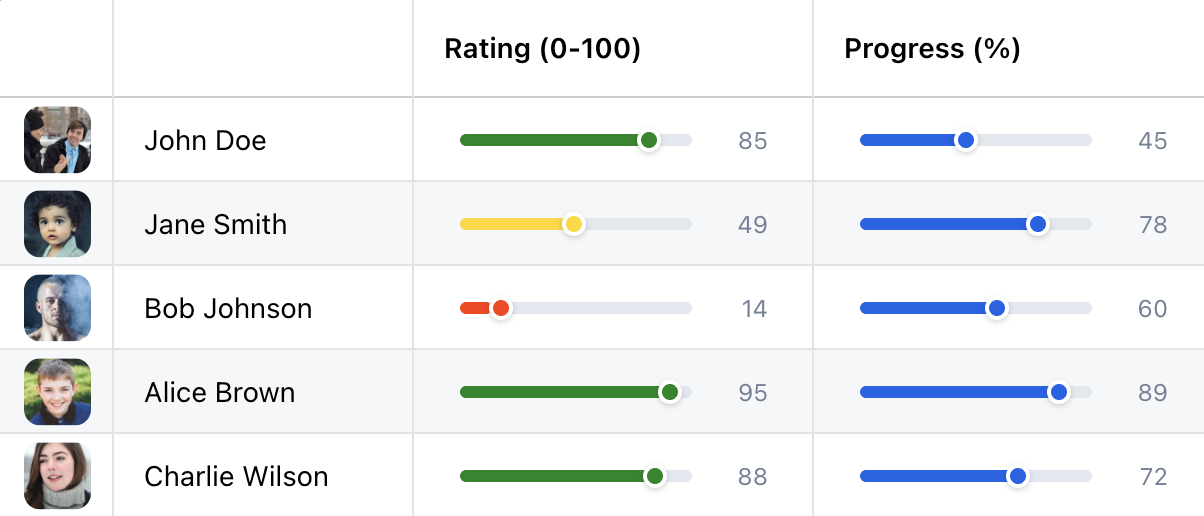
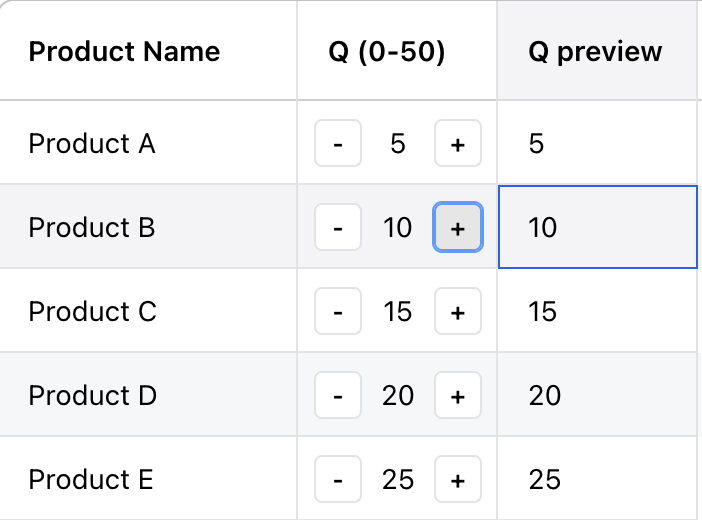
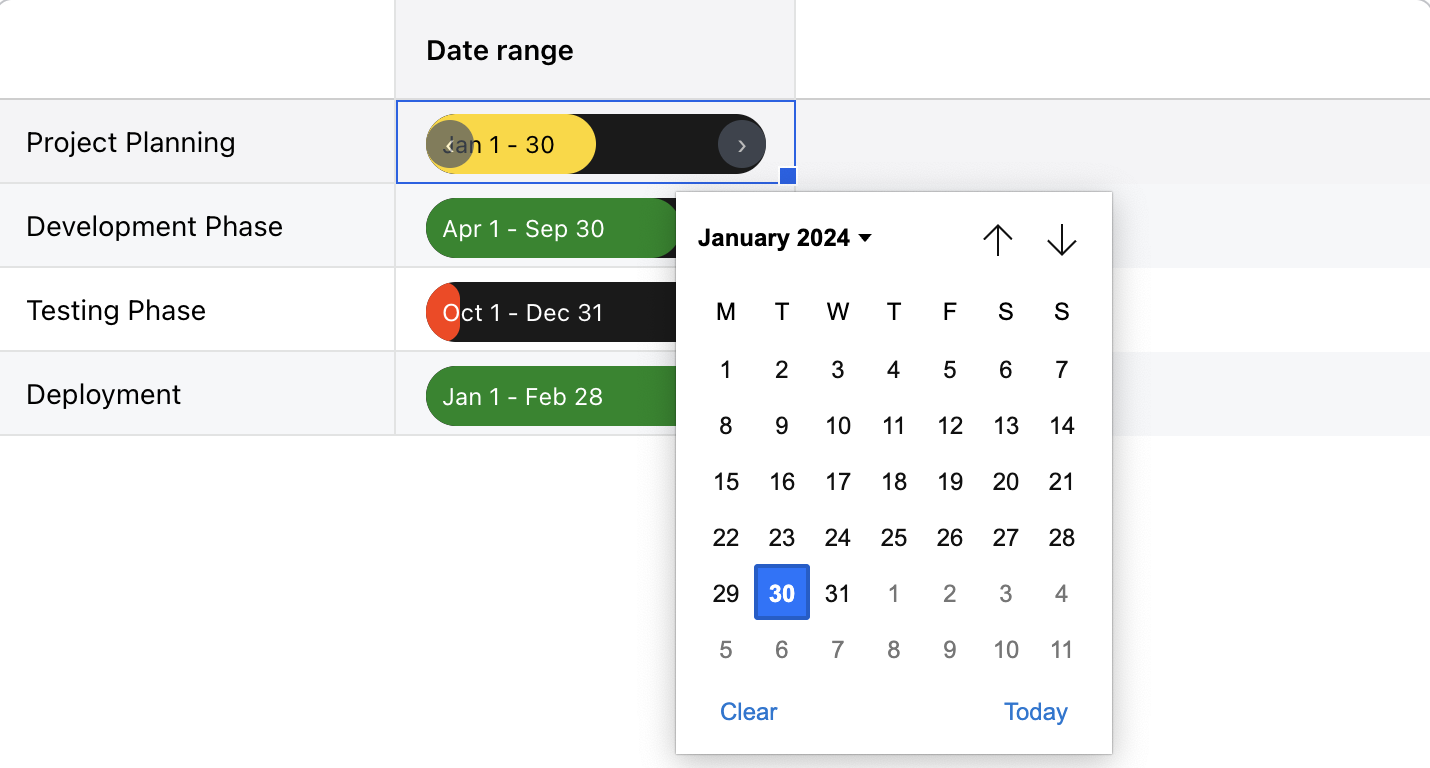
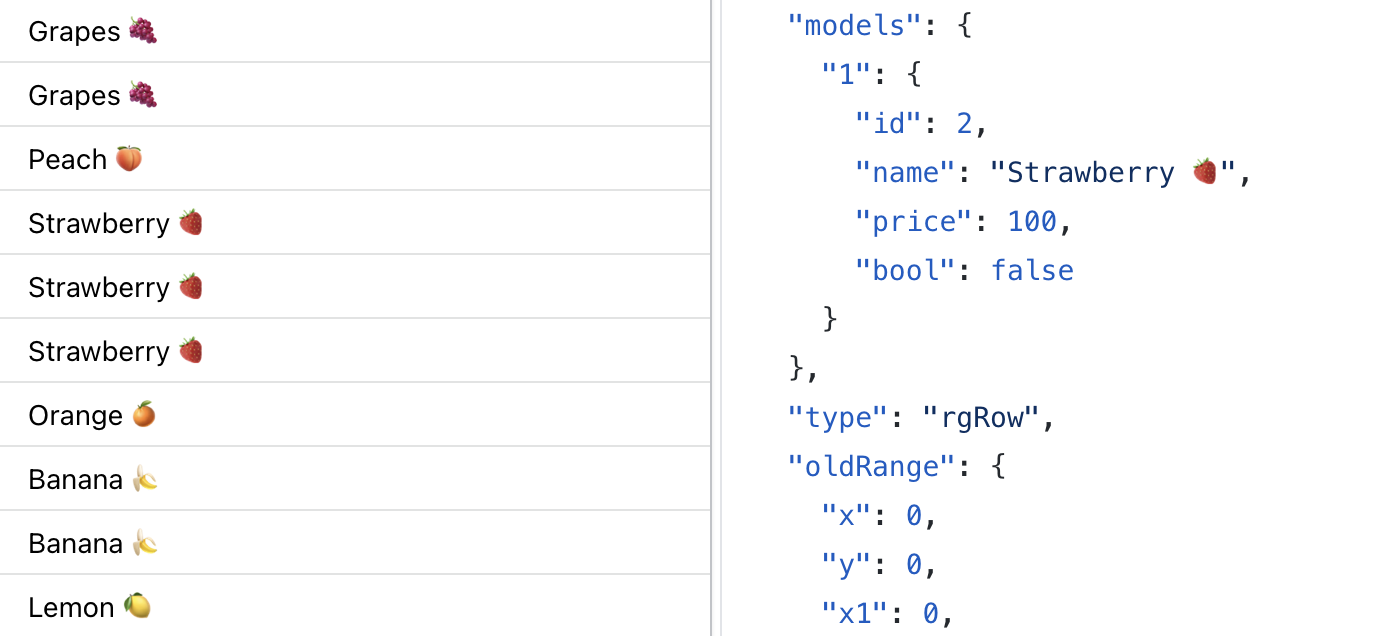
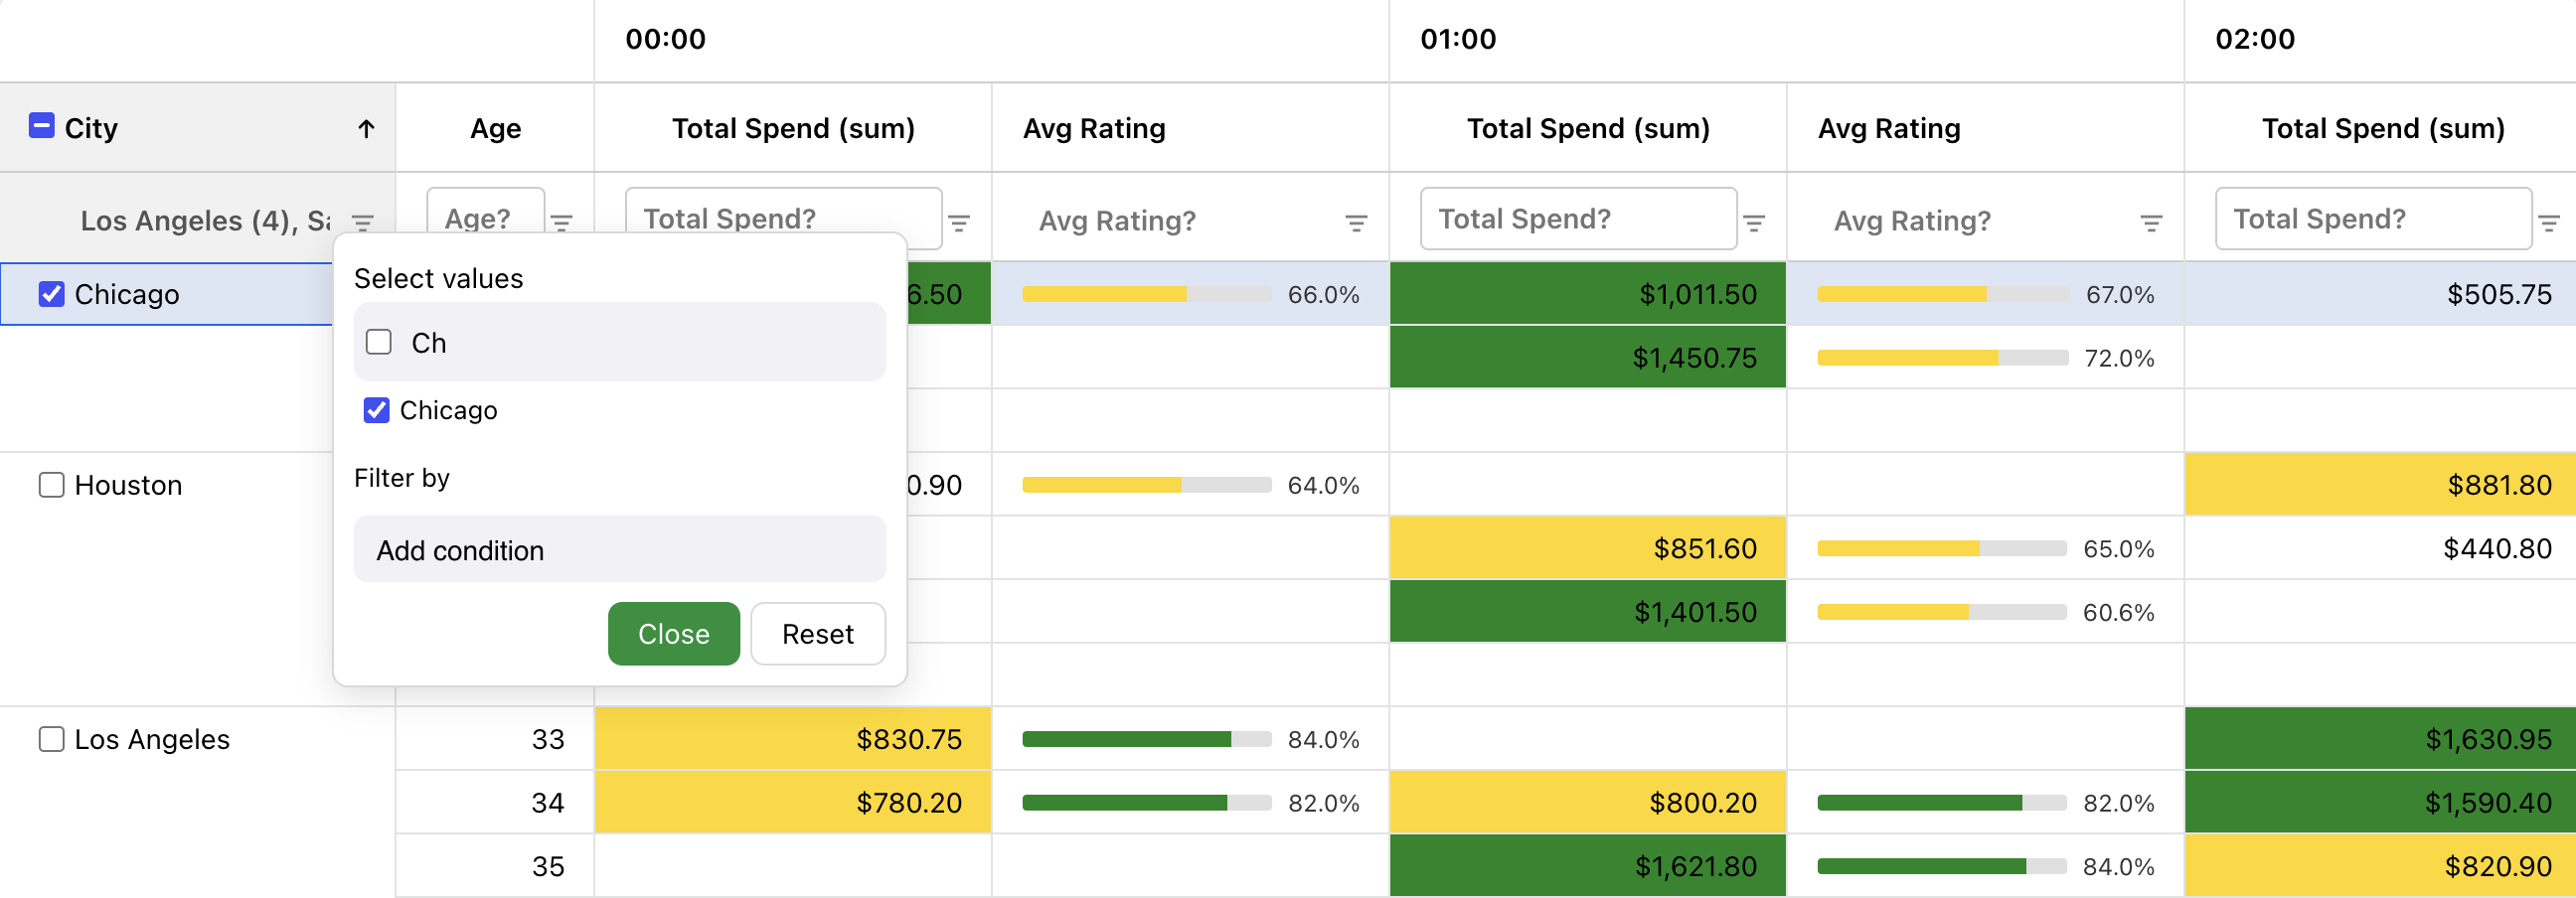
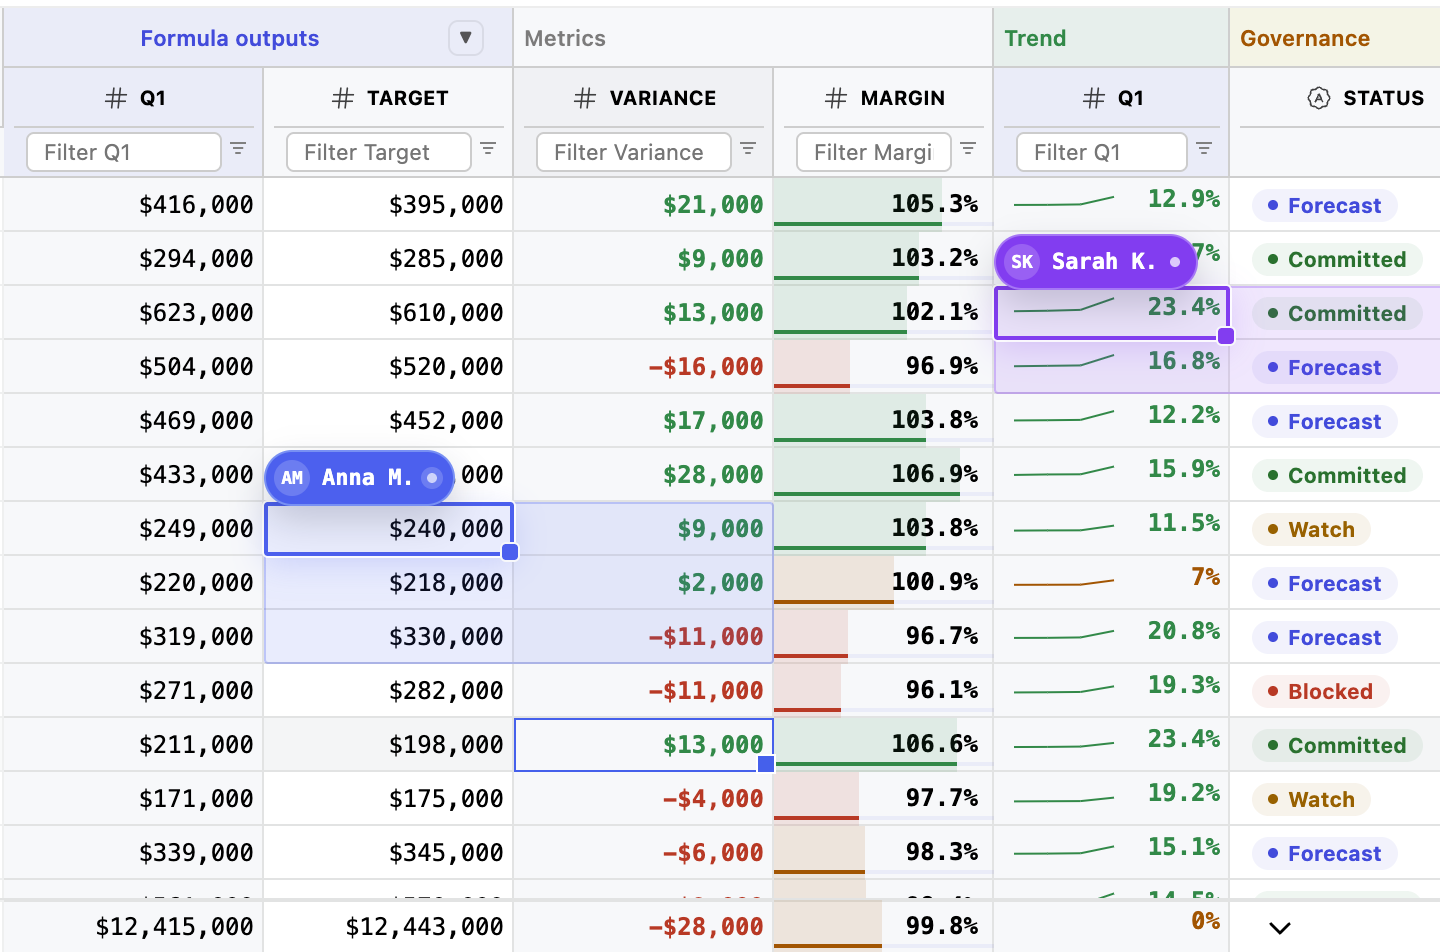
100+ Excel formulas, smart auto-fill, multi-range selection, range copy preview, multiuser editing, filtering, cell merge, inline cell charts, a rich library of column types, column collapse/expand, .xlsx import and export matching the grid view. Your users get the UX they already know - without leaving your product.
Saves
10-14 wks
vs formula engine work
Replaces - Handsontable, Luckysheet, HyperFormula glue