React
High-performance data grid
JavaScript Data Grid for complex web apps
The world's fastest JavaScript data grid. Inline editing, virtual scroll, and custom cells for every major framework.
Market Data · RevoGrid
Used by teams at companies including
Companies using RevoGrid
Core capabilities
A grid engine, not a fixed component
RevoGrid is built for applications that outgrow simple table libraries.
Performance at scale
Renders millions of rows at 60 fps. Virtual scrolling, frozen columns, and pinned rows — no pagination required.
Spreadsheet-grade editing
Range selection, keyboard navigation, copy/paste, and inline editing. The UX your users already know.
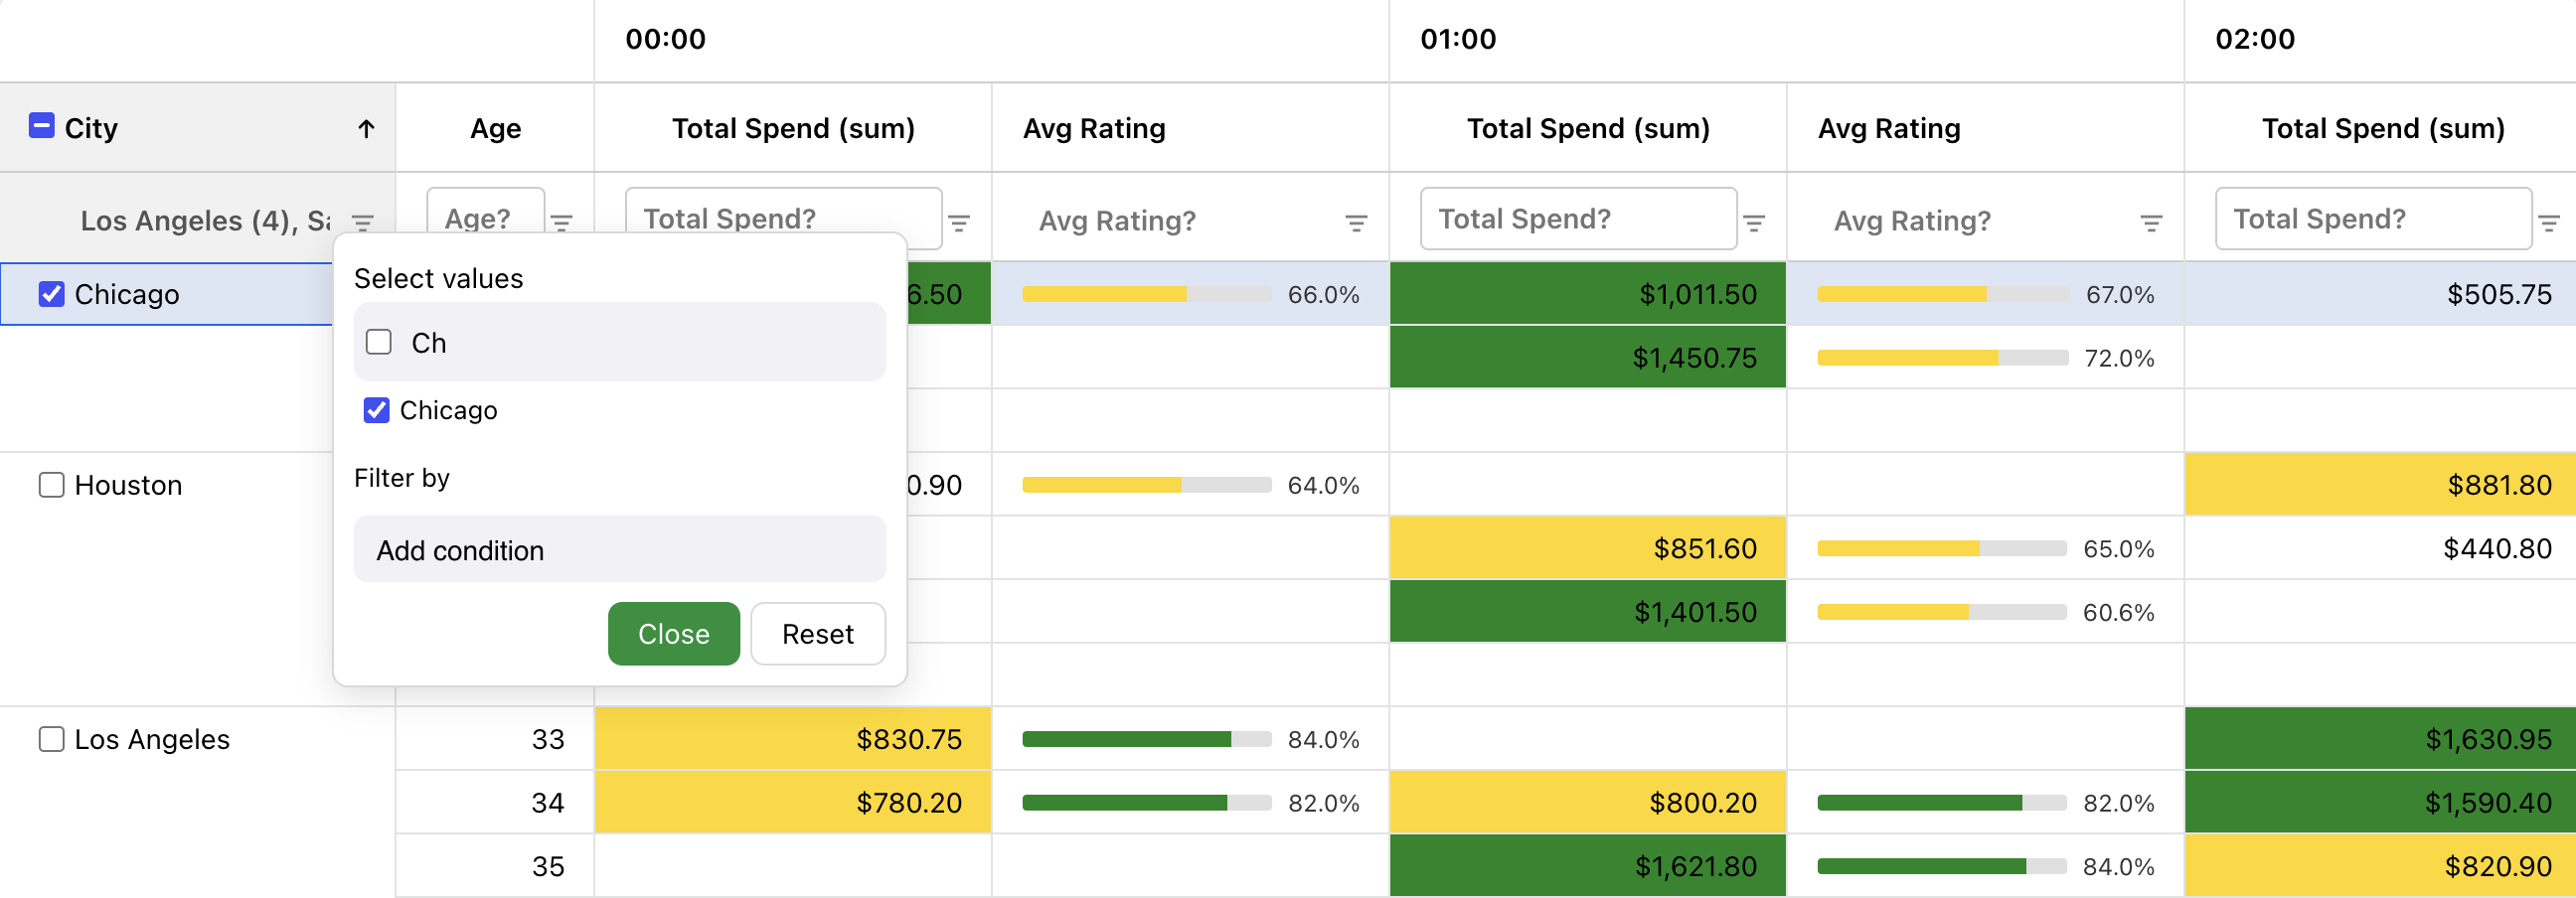
Advanced filtering and sorting
AND/OR condition trees across multiple filters per column. Additive multi-column sorting. All built into the core.
Grouping and row ordering
Group rows by any column. Drag to reorder. Full tree and nested data support included.
Custom cells and editors
Any Vue, React, Angular, or Svelte component becomes a cell. Build pickers, badges, sparklines — whatever you need.
Plugin architecture
Add column menus, export, history, or build your own. Extend without forking.
For developers
Start simple. Customize deeply when you need it.
RevoGrid is a single npm install away. A working grid takes a few lines of markup. Custom cells, virtual rows, column types, and row editing layer in as your application grows.
Advanced modules
Start with the core-grid. Add modules when you need them.
RevoGrid scales from a fast editable grid to advanced product workflows without switching tools or rewriting integrations.
 ▶
▶✕
Advanced Reporting Pro Advanced
Pivot, aggregate, and summarize complex datasets directly inside your app. Drag-and-drop dimensions, drill-down, and totals — no BI tool required.
Learn more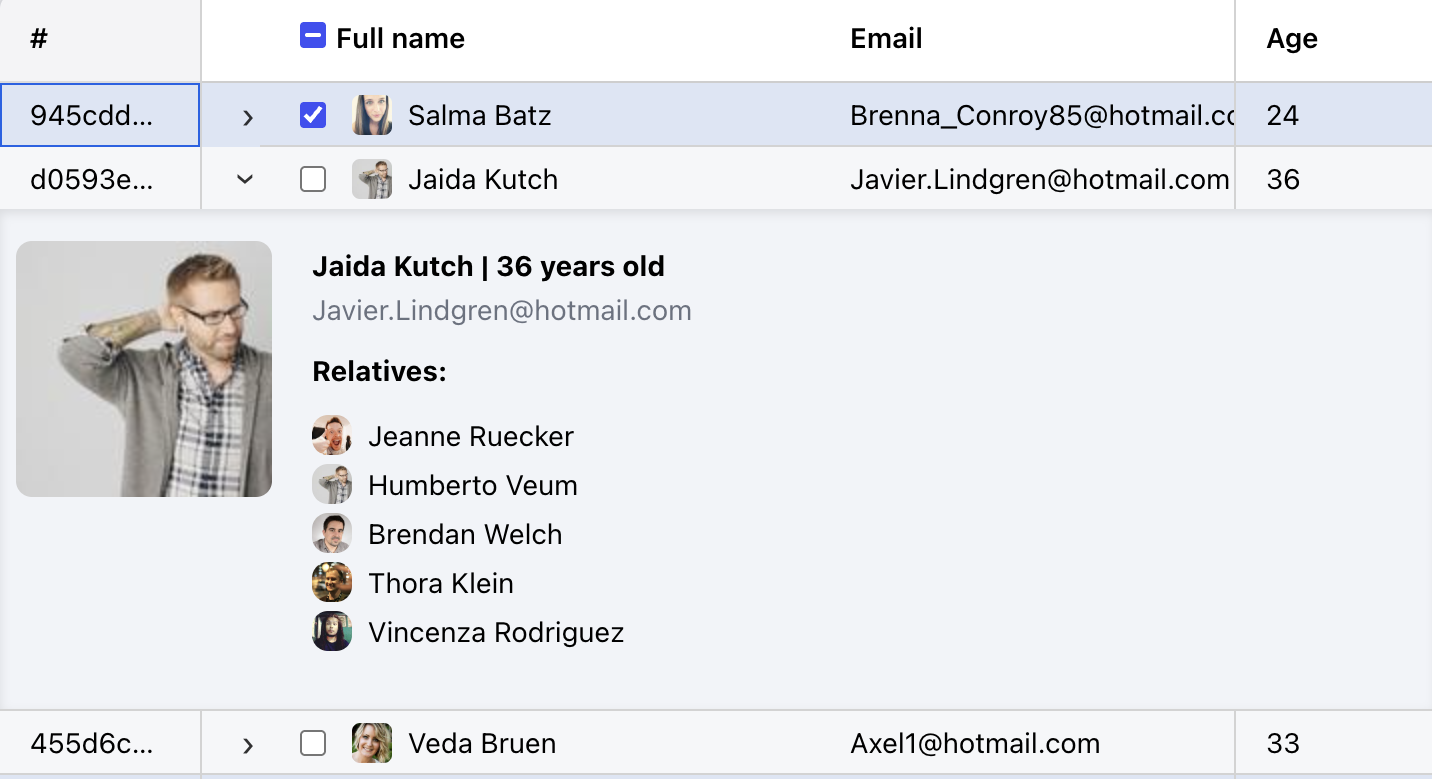 ▶
▶✕
Master Detail Pro Lite
Expand any row into a nested grid, form, or custom view. The UX pattern your customers already expect in real product interfaces.
Learn more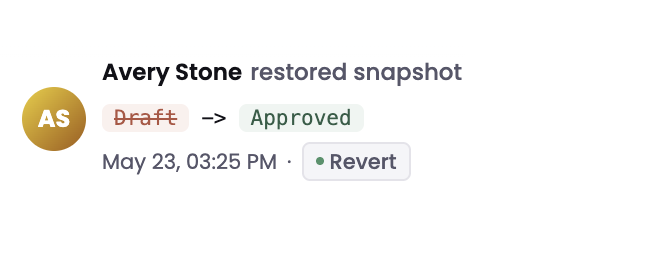 ▶
▶✕
Audit Trail Pro Lite
Record every cell change with who, what, and when. Filter, review, and export the full history. No DIY work required.
Learn moreWhy RevoGrid
More powerful than basic tables. Easier to adopt than heavy enterprise suites.
| Feature | Simple table libs | RevoGrid | Enterprise suites | Custom in-house |
|---|---|---|---|---|
| Virtualized row rendering 1M+ Rows and Columns | × | ✓ | ✓ | ± |
| Spreadsheet-style UX | × | ✓ | ✓ | ± |
| Custom cell renderers | ± | ✓ | ✓ | ✓ |
| Plugin architecture | × | ✓ | ± | ± |
| All major frameworks | ± | ✓ | ✓ | ± |
| Advanced modules | × | Pro plans | ✓ | × |
| Simple per-developer licensing | not applicable | ✓ | Complex | not applicable |
| Self-serve purchase | ✓ | ✓ | sales-led | not applicable |
| Time to first grid | Minutes | Minutes | Days | Weeks |
FAQ
Common questions
Yes. Commercial plans cover production SaaS applications. Your end users can use the product without any additional licensing.
RevoGrid supports React, Vue, Angular, Svelte, JavaScript, and TypeScript-oriented projects from the same grid foundation.
Yes. RevoGrid uses typed configuration, framework examples, FAQ-style docs, and Pro MCP access so coding agents can retrieve real grid context before generating JavaScript grid code.
No. RevoGrid Pro pricing is based on the selected plan and developer licenses, not deployments, environments, servers, or end users.
Pro Lite covers one product or app and includes typed Pro packages through private npm. Pro Advanced adds unlimited product usage, original private source repository access, Pivot, Gantt, Scheduler, and priority support.
Yes. Request a 30-day trial for approved private npm access. The public trial repository is boilerplate for evaluation setup; it does not contain the Pro packages.
Pro Lite covers one product or app. Pro Advanced allows unlimited product usage. Enterprise terms can be customized for larger organizations.
Build your next complex data interface with RevoGrid.
Start with the core grid today. Add Pivot, Gantt, and advanced modules as your product grows.
Per-developer licensing. No deployment counting. Upgrade anytime.