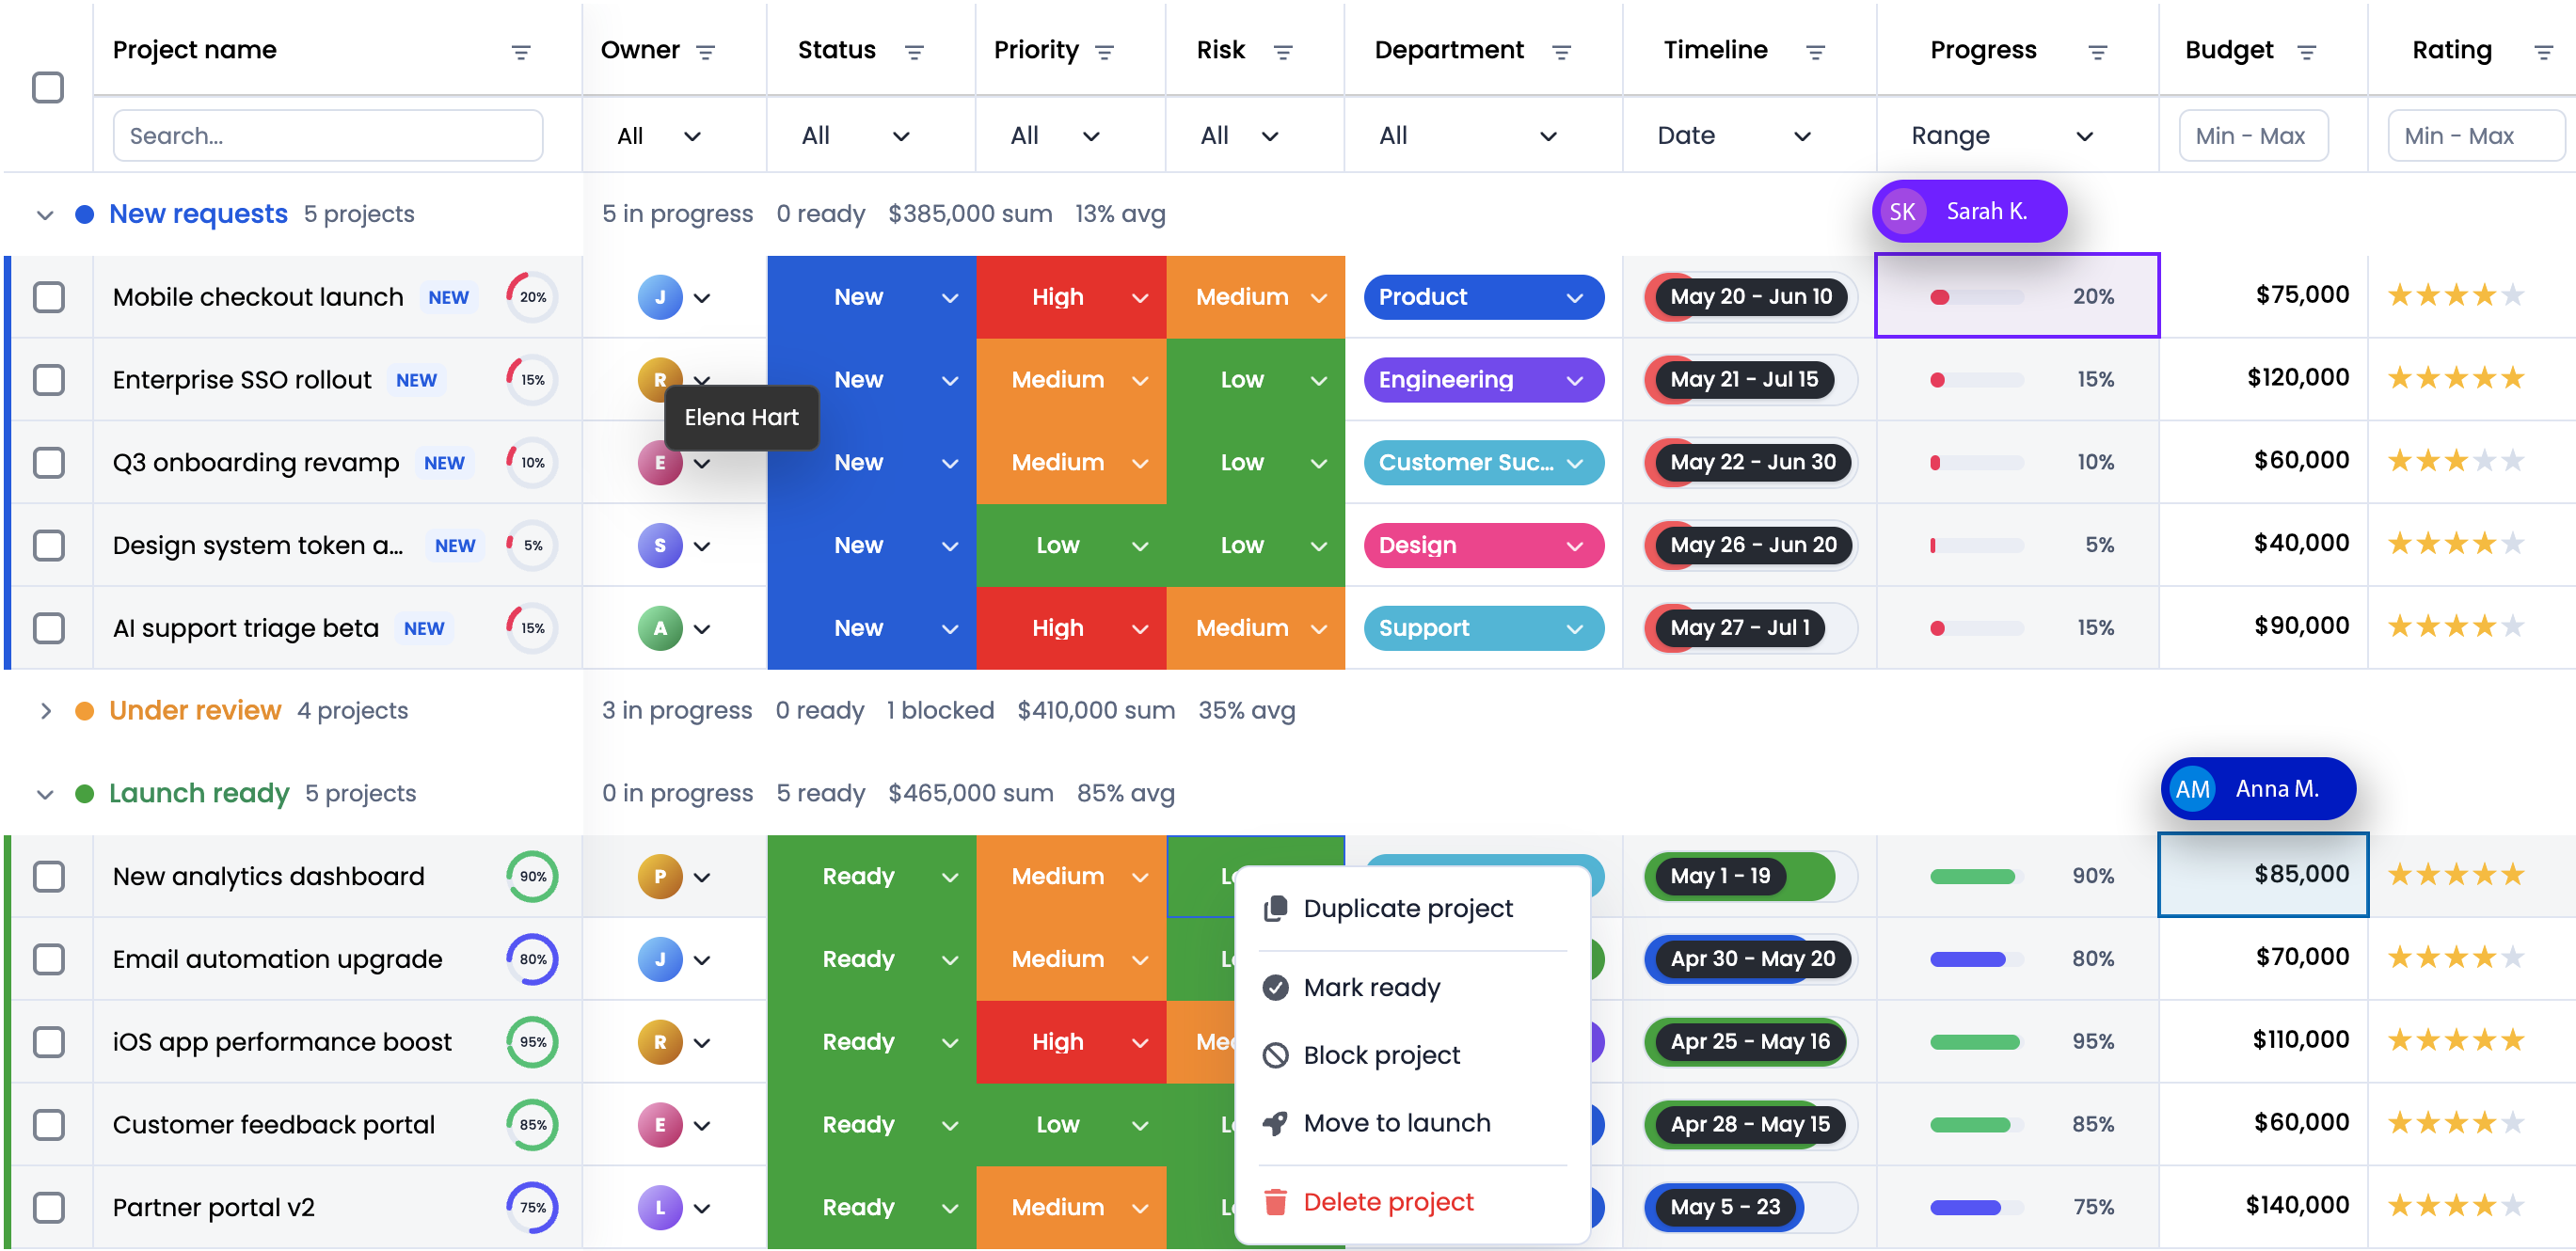
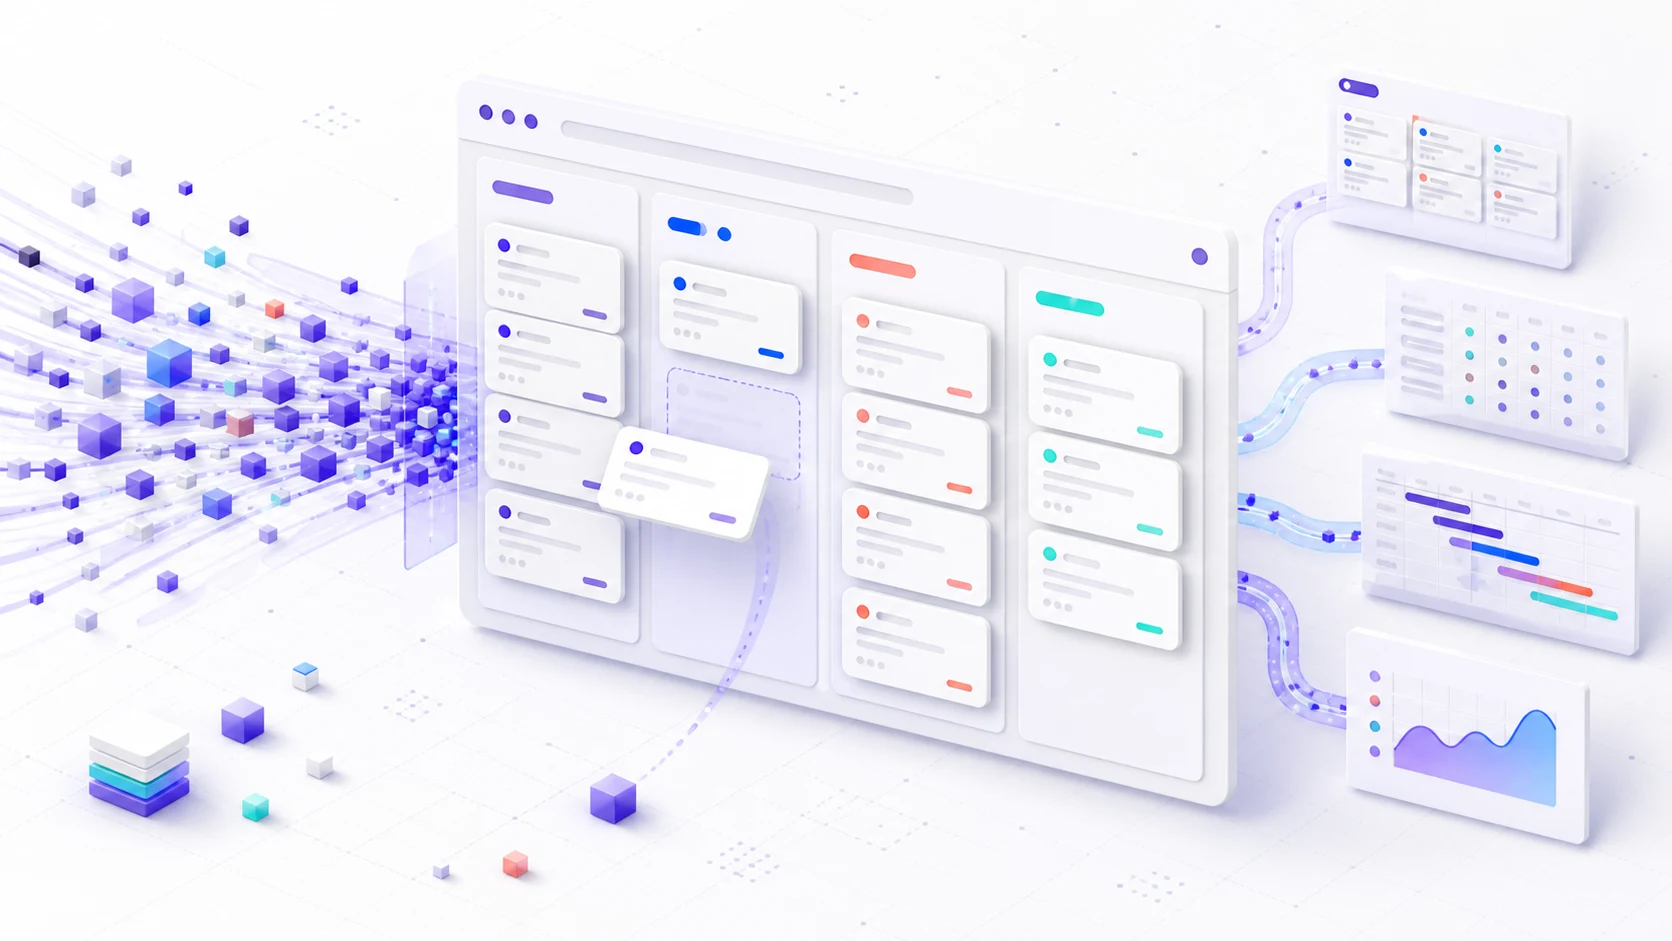
RevoGrid Pro 4.0: AI Agents, Server Data, and Connected Charts
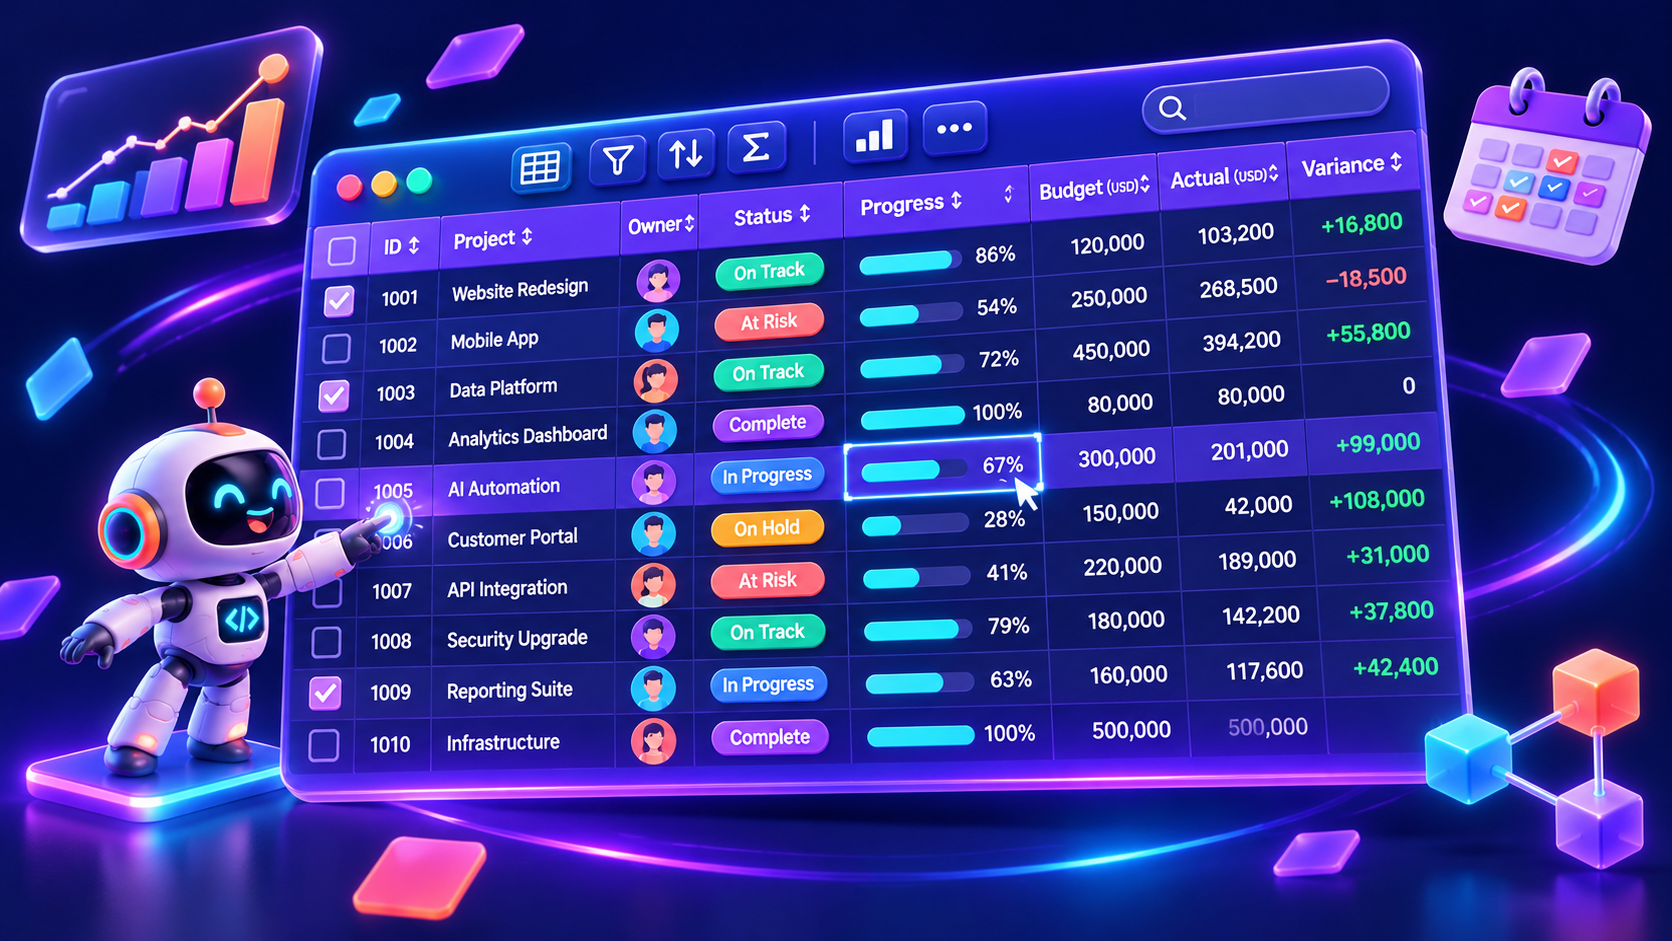
RevoGrid Pro 4.0 brings AI Agent support, smarter server data loading, charts connected directly to grid data, and a shared UI library for building consistent applications.
This release connects more of your workspace. Tables, Pivot reports, charts, and planning tools gain new ways to load data, respond to changes, and put useful controls in users’ hands.
Work with your data through AI Agents
RevoGrid Pro 4.0 introduces AI Agent support across Data Grid, Pivot, Gantt, Scheduler, and Kanban.
Users can describe what they want in natural language. A prompt such as “Show orders above 1000” can apply a grid filter. Product integrations extend the assistant to supported actions for configuring Pivot reports, updating task and event fields, and working with Kanban cards.
You connect the assistant to your application’s backend and model provider, then choose which actions and fields it can access. Supported edits are previewed for approval before they are applied.
Explore the AI Assistant and its product integrations.
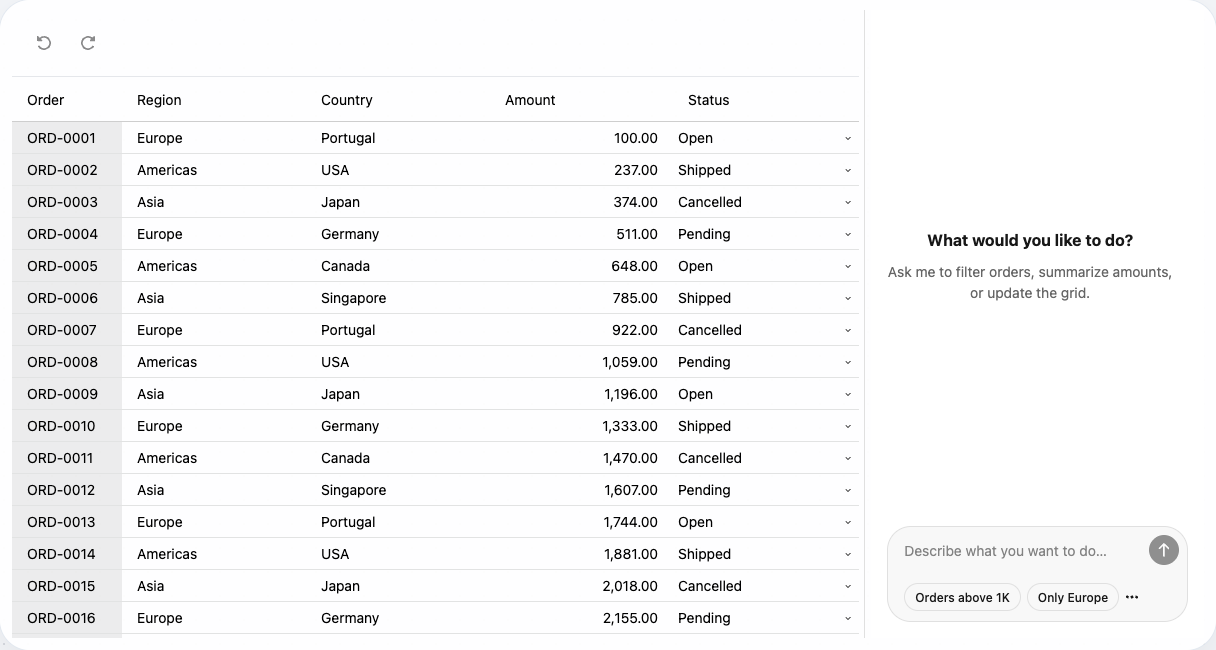
The AI assistant beside a live orders grid.
Smarter server data loading with TanStack Query
Remote data needs more than a fetch request. Applications also need to decide when to reuse cached results, refresh stale records, retry failed requests, and cancel work that is no longer needed.
RevoGrid Pro 4.0 uses TanStack Query Core to manage server reads, bringing configurable caching, freshness, retries, polling, and automatic refresh to the data layer.
Equivalent requests can be shared between configured views, helping avoid duplicate work. You can connect existing data loaders and choose how supported components cache and refresh their data.
Read the server data loading and caching guide.
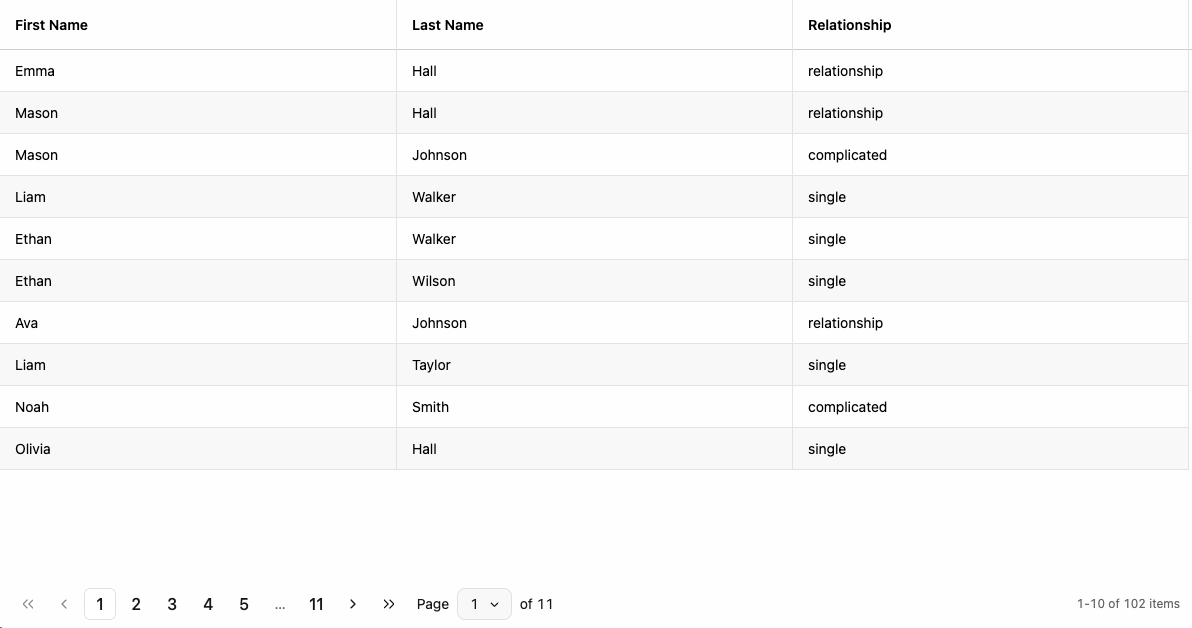
Server-loaded records with pagination controls.
Load large trees and schedules in parts
Version 4.0 extends partial server loading across Tree Data, Scheduler, and Gantt:
- Tree Data loads root records and child rows as users expand nodes and scroll.
- Scheduler fetches events for the visible date range and loads resources in pages.
- Gantt loads scheduled task pages as users explore the project hierarchy, while the backend maintains the complete schedule.
Your application can fetch the records needed for the current view, reducing the amount of data loaded up front.
Explore remote loading for Tree Data, Scheduler, and Gantt.
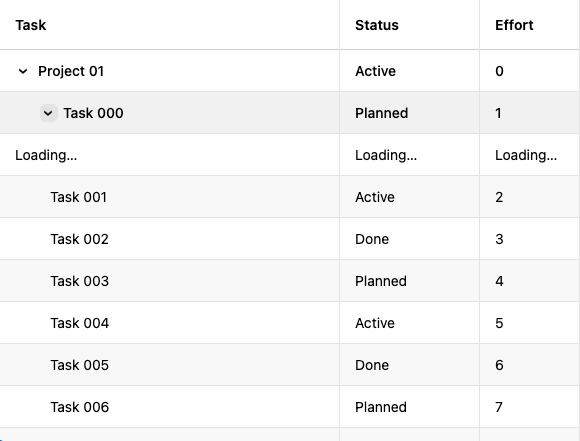
An expanded project with loaded tasks and a nested branch fetching its children.
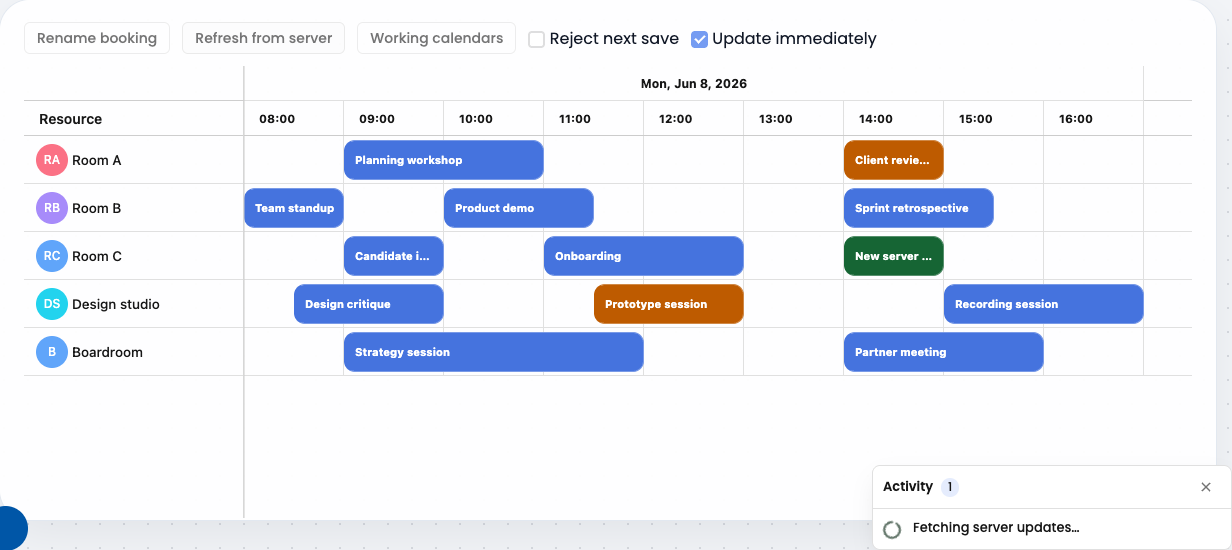
Scheduler keeps bookings visible while fetching server updates.
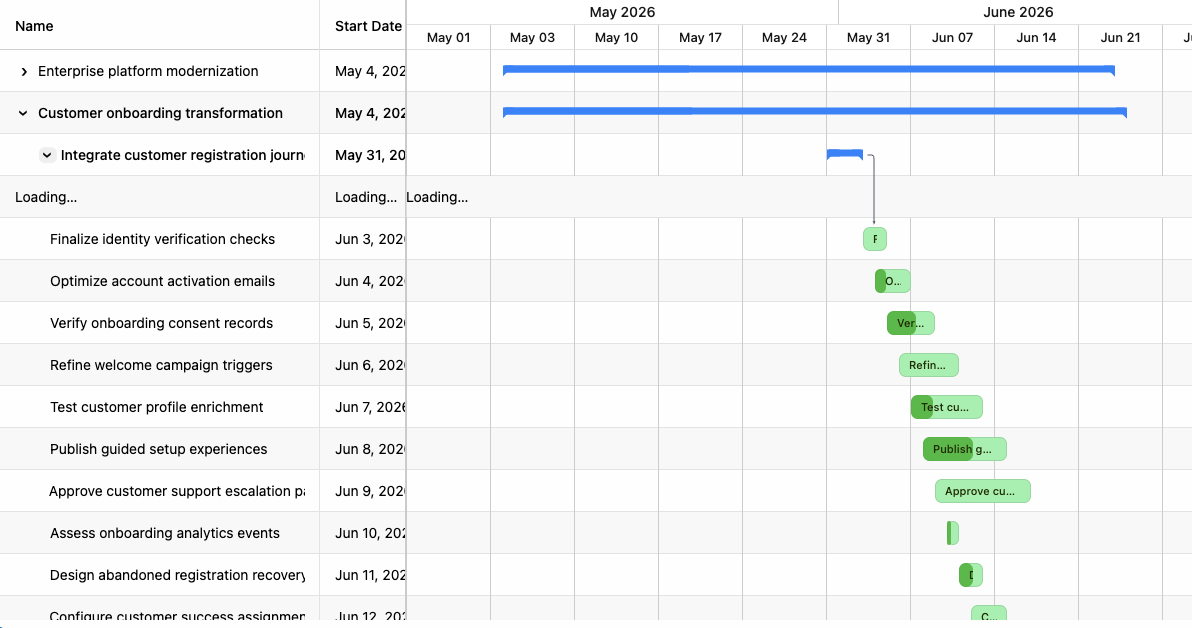
An expanded Gantt hierarchy with a native loading row for the next task level.
Turn grid data into connected charts
The new GridChartsPlugin connects charts directly to regular RevoGrid tables, extending chart integration beyond Pivot reports.
Charts can use the grid’s filtered and sorted view, loaded source data, or selected cell ranges. Committed edits and source updates refresh chart values automatically.
For example, users can filter a sales table to a specific region and see the matching records in a chart. When they edit a value, the chart reflects that change.
Learn about grid chart integration.
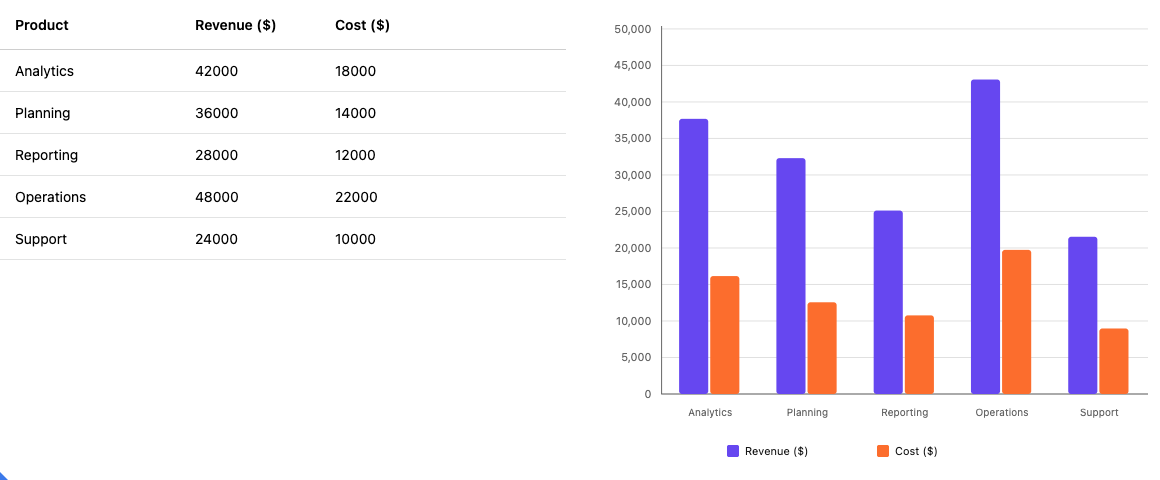
A separate Revo Charts chart connected to the grid through GridChartsPlugin.
Meet Revo UI
RevoGrid Pro 4.0 introduces Revo UI, the shared component library behind many of its controls.
Available as @revolist/ui, the library includes buttons, inputs, date pickers, dialogs, panels, and field controls. You can use these components throughout your application to give toolbars, forms, sidebars, and grid controls a consistent appearance.
Revo UI is MIT-licensed, works independently, and includes adapters for React, Vue, Angular, Svelte, Preact, and vanilla TypeScript.
Explore Revo UI.
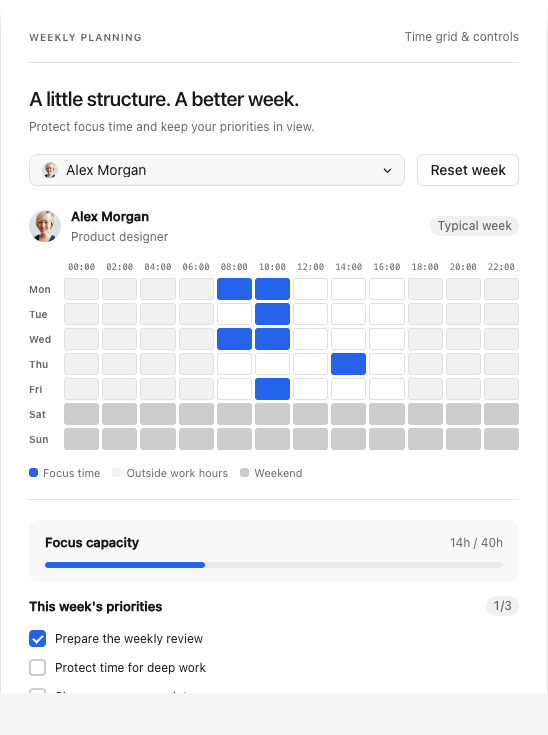
The weekly planner built from Revo UI components.
The new Grid Configurator brings common customization tasks into a single panel.
Users can search, show, hide, and reorder columns, configure row groups and summaries, and manage filters. Mount it beside the grid or inside your application’s sidebar, with compact and resizable modes to fit your workspace.
Grid, Pivot, and Pivot Charts also share field controls and a consistent configurator design. Users get familiar interactions as they move between tables, reports, and charts, with settings tailored to each component.
Explore the Grid Configurator and Pivot Charts configurator.
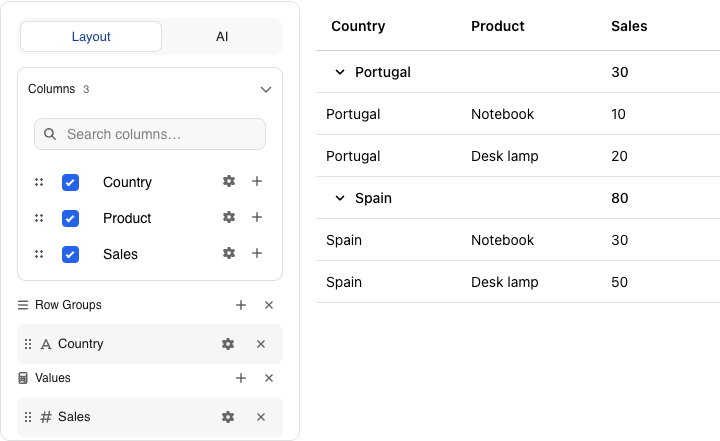
The shared configurator controls beside a grouped sales grid.
Keep Kanban controls within reach
The new Kanban toolbar brings card actions, search, field filters, card counts, and Board/Table view switching into a configurable command bar.
When the shared history service is enabled, it also provides undo and redo. Controls follow the board’s configured permissions and editing behavior.
Explore the Kanban toolbar.
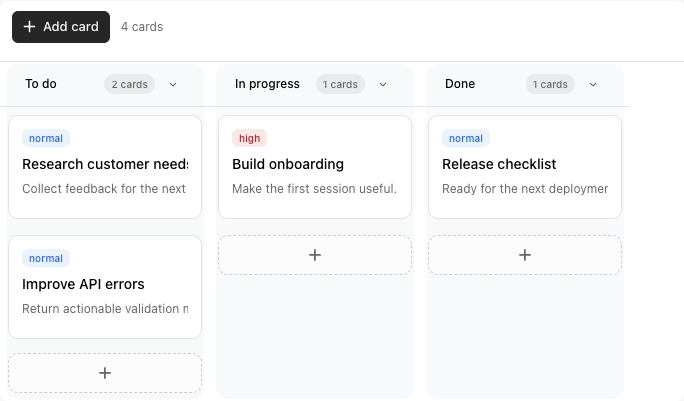
The Kanban toolbar in the interactive documentation example.
Explore RevoGrid Pro 4.0
Whether you are building an analytical dashboard, a planning workspace, or a data management application, RevoGrid Pro 4.0 gives you more ways to connect data, visualization, and user actions.
Try the interactive demos, explore the documentation, and discover the components available in Revo UI.