
A High-Performance Data Grid for Dash Apps
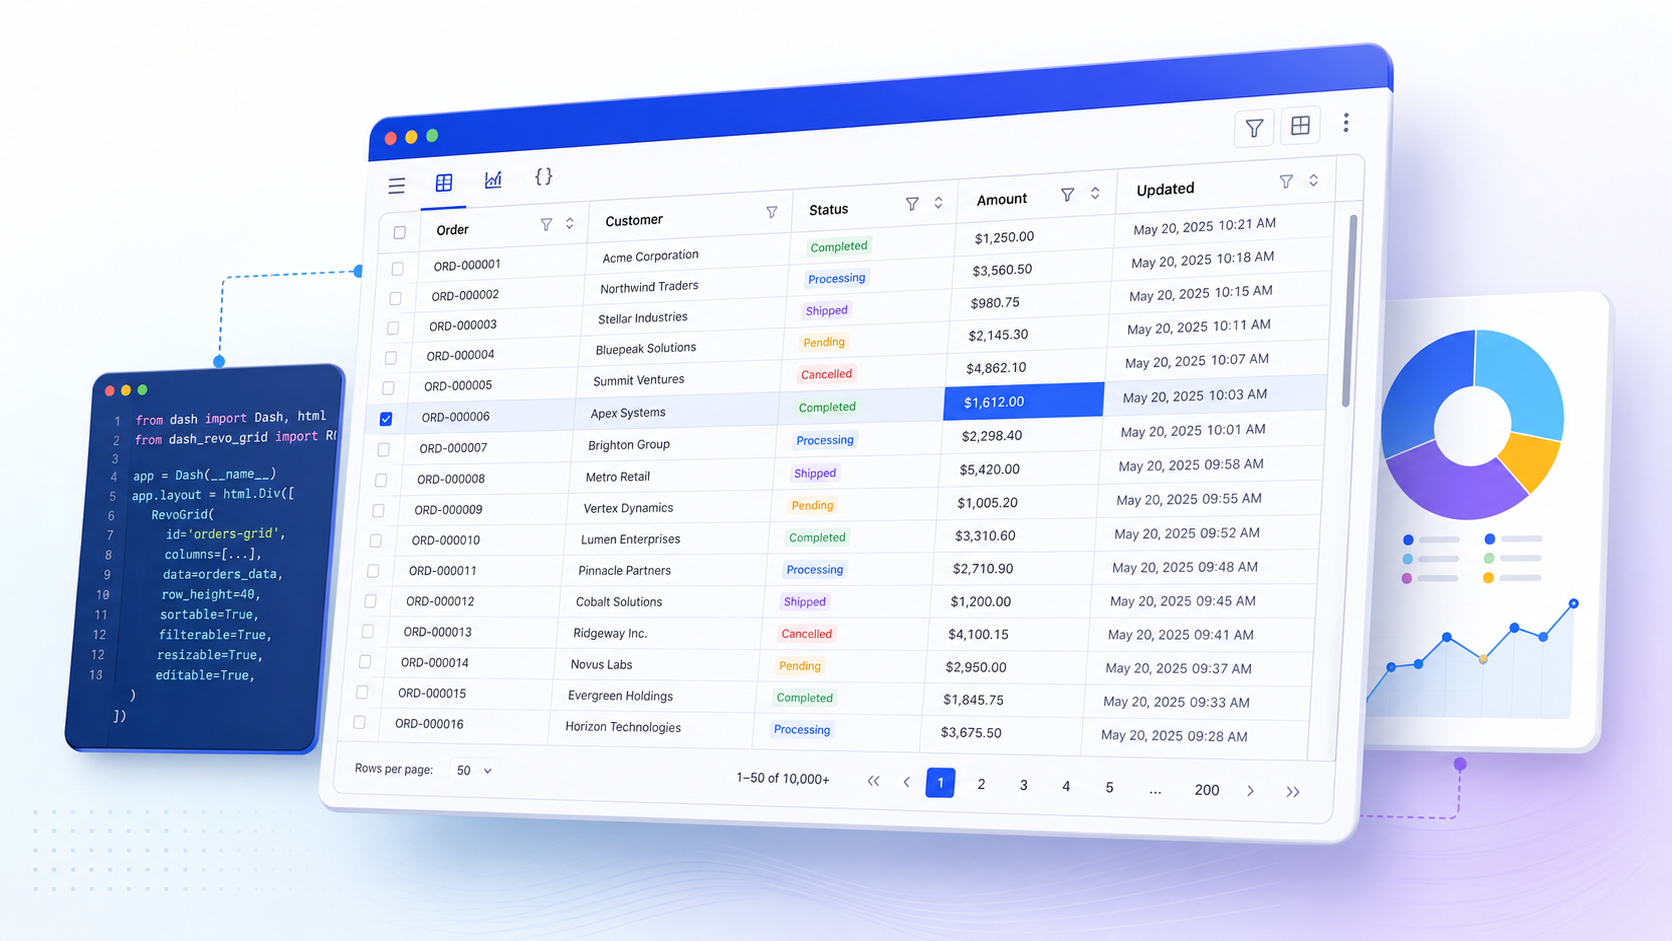
Dash makes it easy to turn Python data into an interactive web application. A table often starts as a small part of that app: a few columns from a Pandas DataFrame, perhaps with a filter or two.
Then the requirements grow.
Users want to edit values, paste data from a spreadsheet, sort several columns, work with thousands of records, and trigger Python logic when something changes. At that point, a basic HTML table is no longer enough. You need a real Dash data grid.
RevoGrid for Dash brings RevoGrid's virtualized, editable data grid to Python and Plotly Dash. You configure it with Python dictionaries, pass it rows from Pandas, and listen to grid events through normal Dash callbacks.
What you will build
By the end of this guide, you will have an editable Dash grid backed by Pandas, with filtering, sorting, clipboard support, compact edit callbacks, and virtual scrolling.
| Requirement | RevoGrid approach |
|---|---|
| Display a DataFrame | Convert it with df.to_dict("records") |
| Edit and validate data | Listen to the afteredit callback property |
| Sort and filter | Configure behavior in the column definitions |
| Handle large in-browser datasets | Virtualize rows and columns automatically |
| Avoid large callback requests | Send the changed cell instead of the full source |
This guide covers:
- installation
- a basic Python example
- loading a Pandas DataFrame
- sorting, filtering, and editing
- handling cell changes through Dash callbacks
- virtual scrolling for large datasets
- the difference between MIT and Pro features
- a complete runnable example
What is RevoGrid for Dash?
dash-datagrid is the official RevoGrid component for Plotly Dash.
Under the hood, it uses the same RevoGrid engine as the JavaScript, React, Vue, Angular, and Svelte integrations. The grid handles rendering and virtualization in the browser, while Dash remains responsible for your Python application and callbacks.
That separation is useful. Dash does not need to create and manage every visible cell itself, and you do not need to write a React wrapper to use the grid from Python.
The package gives you:
- virtualized rows and columns;
- inline cell editing;
- sorting and built-in filters;
- row headers and pinned rows;
- range selection and clipboard support;
- column resizing and reordering;
- row grouping;
- Dash callback properties for RevoGrid events;
- the same underlying grid model used by other RevoGrid framework integrations.
The current package supports Python 3.10 or newer and Dash 3.x or 4.x.
Install the Dash data grid
Create a virtual environment and install the package from PyPI:
python -m venv .venv
source .venv/bin/activate
python -m pip install dash-datagrid pandas
On Windows PowerShell:
python -m venv .venv
.venv\Scripts\Activate.ps1
python -m pip install dash-datagrid pandas
The Python package already includes the JavaScript bundle used by the component. You do not need a separate npm installation for a normal Dash app.
Build your first RevoGrid Dash app
Here is the smallest useful example:
from dash import Dash
from dash_datagrid import RevoGrid


app = Dash(__name__)

app.layout = RevoGrid(
    columns=[
        {"prop": "product", "name": "Product"},
        {"prop": "quantity", "name": "Quantity"},
        {"prop": "price", "name": "Price"},
    ],
    source=[
        {"product": "Keyboard", "quantity": 12, "price": 95},
        {"product": "Mouse", "quantity": 24, "price": 35},
        {"product": "Monitor", "quantity": 8, "price": 280},
    ],
    style={"height": 320},
)


if __name__ == "__main__":
    app.run(debug=True)
Save it as app.py, then run:
python app.pyOpen the address printed in the terminal, usually http://127.0.0.1:8050.
Two props provide most of the initial setup:
columnsdefines the grid schema;sourcecontains the row data.
Each column's prop must match a key in the source rows. The name is the label shown in the header.
The explicit height is important. RevoGrid fills the height of its host element, so a grid without a height can appear empty.
Use a Pandas DataFrame
Most Dash applications already keep their data in a Pandas DataFrame. RevoGrid expects JSON-serializable row dictionaries, so the usual conversion is one line:
rows = df.to_dict("records")A complete DataFrame example looks like this:
import pandas as pd
from dash import Dash
from dash_datagrid import RevoGrid


df = pd.DataFrame(
    [
        {"order": "A-100", "customer": "Ada", "status": "Open", "amount": 120},
        {"order": "A-101", "customer": "Grace", "status": "Paid", "amount": 85},
        {"order": "A-102", "customer": "Linus", "status": "Open", "amount": 210},
    ]
)

app = Dash(__name__)

app.layout = RevoGrid(
    columns=[
        {"prop": "order", "name": "Order"},
        {"prop": "customer", "name": "Customer"},
        {"prop": "status", "name": "Status"},
        {"prop": "amount", "name": "Amount"},
    ],
    source=df.to_dict("records"),
    style={"height": 360},
)


if __name__ == "__main__":
    app.run(debug=True)
DataFrames with dates or missing values
Dash props must be JSON serializable. A DataFrame can contain values such as Pandas timestamps, NumPy scalars, NaN, or NaT that need normalizing first.
For mixed data, use a JSON round trip:
import json

rows = json.loads(
    df.to_json(
        orient="records",
        date_format="iso",
    )
)
This converts timestamps to ISO strings and missing values to JSON null.
Add sorting, filtering, and editing
Sorting and filtering are configured on the columns. Editing is available unless the complete grid or an individual column is marked as read-only.
grid = RevoGrid(
    columns=[
        {
            "prop": "order",
            "name": "Order",
            "readonly": True,
            "size": 120,
        },
        {
            "prop": "customer",
            "name": "Customer",
            "sortable": True,
            "filter": "string",
            "size": 180,
        },
        {
            "prop": "status",
            "name": "Status",
            "sortable": True,
            "filter": "string",
        },
        {
            "prop": "amount",
            "name": "Amount",
            "sortable": True,
            "filter": "number",
        },
    ],
    source=rows,
    filter=True,
    resize=True,
    range=True,
    useClipboard={"rangeFill": True},
    applyOnClose=True,
    rowHeaders=True,
    style={"height": 420},
)
This configuration gives users a much more practical data-entry surface:
- click a sortable header to change the order;
- use string and number filters;
- edit any cell except the order ID;
- resize columns;
- select a range of cells;
- copy and paste data;
- fill values across a selected range.
If the whole grid should be used only for viewing, add readonly=True.
You can also provide an initial sort:
sorting={
    "columns": [
        {"prop": "amount", "order": "desc"},
    ],
    "additive": False,
}
Or an initial filter:
filter={
    "collection": {
        "status": {"type": "eq", "value": "Open"},
    }
}
Handle cell changes with a Dash callback
Displaying data is only half the job. In a real application, an edit may need to:
- update a database;
- recalculate another value;
- validate the input;
- add an audit entry;
- enable a Save button;
- trigger another chart or KPI.
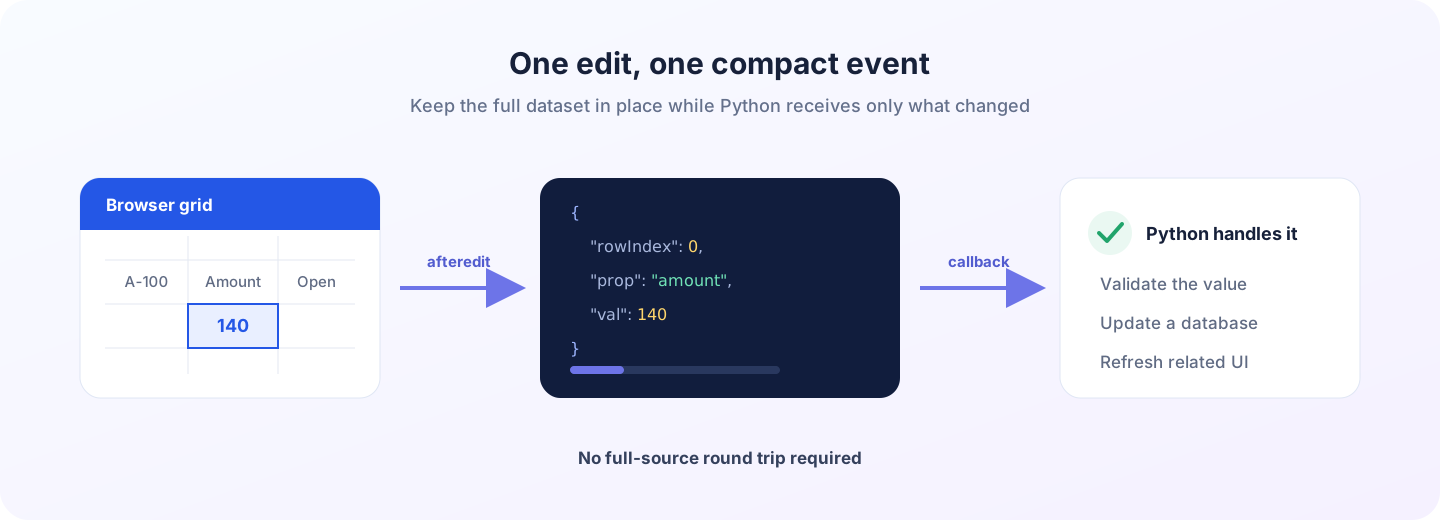
RevoGrid sends cell changes through the afteredit property. You can use it as a normal Dash callback input:
from dash import Input, Output, callback


@callback(
    Output("edit-output", "children"),
    Input("orders-grid", "afteredit"),
    prevent_initial_call=True,
)
def show_edit(event):
    detail = event["detail"]

    if "prop" not in detail:
        return f"Range edit received: {detail}"

    return (
        f'Row {detail["rowIndex"]}, column {detail["prop"]} '
        f'changed to {detail["val"]!r}'
    )
A single-cell edit contains a compact event payload similar to:
{
  "name": "afteredit",
  "detail": {
    "rowIndex": 0,
    "colIndex": 3,
    "prop": "amount",
    "val": 140,
    "type": "rgRow",
    "colType": "rgCol"
  },
  "timestamp": 1784980000000,
  "sequence": 1
}
The important values are usually:
rowIndex: the changed row;prop: the field that changed;val: the new value.
For production data, include a stable ID in every row. A row index can change after sorting or filtering, while an order ID or database ID stays stable.
Do not send the full dataset after every edit
By default, syncSourceOnEdit=False. The browser applies the change and sends the small afteredit event to Python.
That is the right default for a large grid:
cell edit → compact change event → Dash callback → database or APIIf a callback truly needs the entire updated dataset, opt in:
RevoGrid(
    id="orders-grid",
    source=rows,
    columns=columns,
    syncSourceOnEdit=True,
    style={"height": 420},
)
You can then listen to source:
@callback(
    Output("row-count", "children"),
    Input("orders-grid", "source"),
    prevent_initial_call=True,
)
def receive_updated_source(source):
    return f"{len(source)} rows received"
Use this carefully. Full source synchronization serializes and transfers every row after each edit. That is convenient for a small form-like grid, but wasteful for a dataset with tens or hundreds of thousands of records.
Why virtual scrolling matters in a Python Dash data grid
Imagine a dataset with 100,000 rows and 20 columns. Logically, that is two million cells.
A grid should not create two million cell elements in the browser. RevoGrid renders the visible viewport and reuses that view while the user scrolls. Row and column virtualization keep the amount of active browser work relatively small even when the source is large.
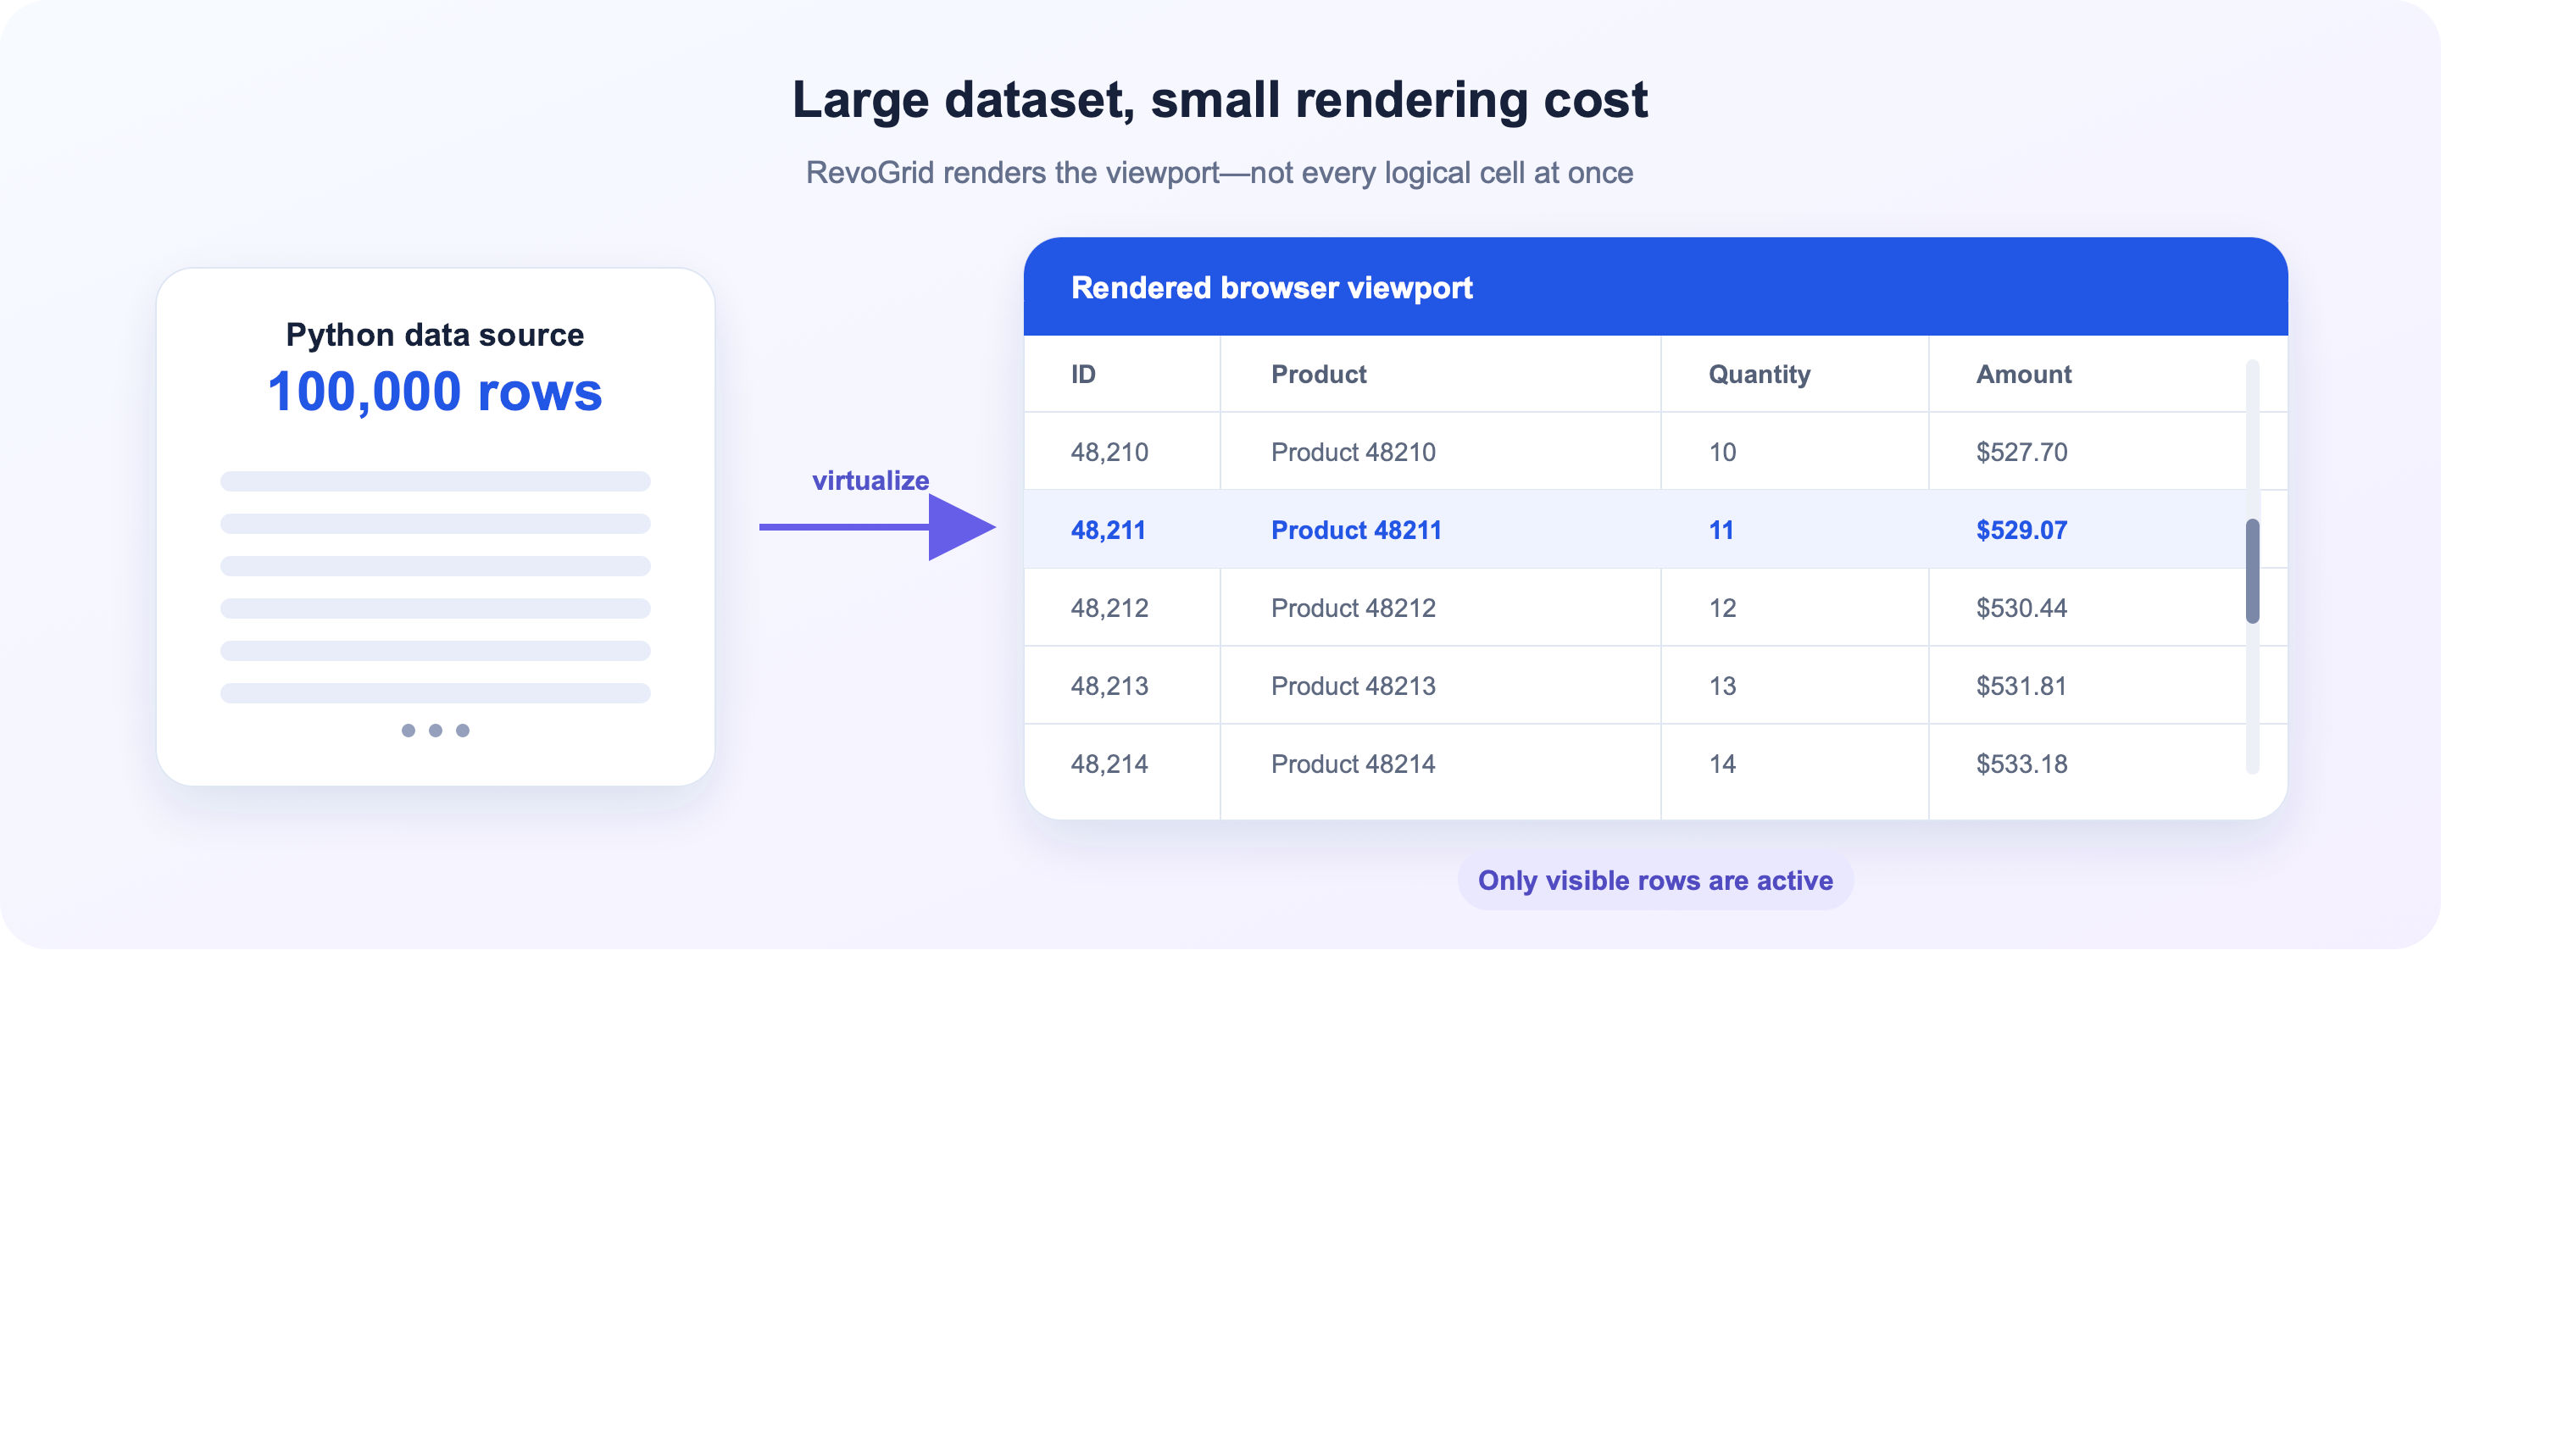
You do not need to enable virtual scrolling separately. It is part of RevoGrid's rendering model.
large_rows = [
    {
        "id": row_id,
        "product": f"Product {row_id}",
        "quantity": row_id % 100,
        "amount": round((row_id * 1.37) % 1000, 2),
    }
    for row_id in range(100_000)
]

grid = RevoGrid(
    columns=[
        {"prop": "id", "name": "ID", "readonly": True, "size": 90},
        {"prop": "product", "name": "Product", "size": 180},
        {"prop": "quantity", "name": "Quantity"},
        {"prop": "amount", "name": "Amount"},
    ],
    source=large_rows,
    style={"height": "70vh"},
)
Virtualization solves the browser rendering problem. It does not make data transfer free. If your application loads millions of records from a database, you should still think about:
- how much data is sent from Python to the browser;
- whether users need every record immediately;
- server-side search or dataset switching;
- compact callback payloads;
- incremental or remote data workflows.
The practical rule is simple: let the grid virtualize what is already in the browser, and avoid moving the full dataset across the network more often than necessary.
RevoGrid MIT versus Pro
You can start with the MIT-licensed RevoGrid Core. It covers the main grid experience needed by many Dash applications.
| RevoGrid Core (MIT) | RevoGrid Pro and advanced modules |
|---|---|
| Virtual rows and columns | Pivot and advanced reporting workflows |
| Cell editing | Gantt Charts |
| Sorting and built-in filtering | Advanced filtering capabilities |
| Range selection | Formulas and advanced spreadsheet workflows |
| Clipboard operations | Master-detail and other product modules |
| Column resizing and movement | Audit history and advanced business workflows |
| Row grouping and pinned rows | Commercial support and enterprise options |
| Dash event callbacks | Additional Pro and Enterprise plugin events |
The dash-datagrid Python package is the official Core component. It can pass Core, Pro, Enterprise, and custom plugin events into Dash callbacks, but installing the Python package alone does not activate paid modules.
This gives teams a straightforward path:
- Build and validate the initial Dash data grid with the MIT core.
- Add Pro capabilities when the application needs a larger business workflow around the grid.
See the RevoGrid pricing page for the current plans and the Dash Data Grid documentation for the Python integration.
Complete runnable Dash data grid example
The example below puts everything together:
- a Pandas DataFrame;
- editable rows;
- sorting and filtering;
- range selection and clipboard support;
- compact edit events;
- a reload button that replaces the source from Python.
Save it as app.py.
import json

import pandas as pd
from dash import Dash, Input, Output, callback, html
from dash_datagrid import RevoGrid


def load_orders():
    frame = pd.DataFrame(
        [
            {
                "id": 1001,
                "customer": "Ada Lovelace",
                "status": "Open",
                "amount": 120.00,
                "updated": pd.Timestamp("2026-07-22"),
            },
            {
                "id": 1002,
                "customer": "Grace Hopper",
                "status": "Paid",
                "amount": 85.50,
                "updated": pd.Timestamp("2026-07-23"),
            },
            {
                "id": 1003,
                "customer": "Linus Torvalds",
                "status": "Open",
                "amount": 210.25,
                "updated": pd.Timestamp("2026-07-24"),
            },
            {
                "id": 1004,
                "customer": "Margaret Hamilton",
                "status": "Review",
                "amount": 160.00,
                "updated": pd.Timestamp("2026-07-25"),
            },
        ]
    )

    return json.loads(
        frame.to_json(
            orient="records",
            date_format="iso",
        )
    )


columns = [
    {
        "prop": "id",
        "name": "Order",
        "readonly": True,
        "size": 110,
        "pin": "colPinStart",
    },
    {
        "prop": "customer",
        "name": "Customer",
        "sortable": True,
        "filter": "string",
        "size": 200,
    },
    {
        "prop": "status",
        "name": "Status",
        "sortable": True,
        "filter": "string",
        "size": 130,
    },
    {
        "prop": "amount",
        "name": "Amount",
        "sortable": True,
        "filter": "number",
        "size": 130,
    },
    {
        "prop": "updated",
        "name": "Updated",
        "sortable": True,
        "readonly": True,
        "size": 190,
    },
]


app = Dash(__name__)

app.layout = html.Main(
    [
        html.H1("Orders"),
        html.P(
            "Sort or filter the data, then edit a customer, status, or amount."
        ),
        html.Button("Reload orders", id="reload-orders", n_clicks=0),
        RevoGrid(
            id="orders-grid",
            columns=columns,
            source=load_orders(),
            rowHeaders=True,
            resize=True,
            canMoveColumns=True,
            range=True,
            useClipboard={"rangeFill": True},
            applyOnClose=True,
            filter=True,
            sorting={
                "columns": [{"prop": "amount", "order": "desc"}],
                "additive": False,
            },
            style={
                "height": 430,
                "marginTop": 16,
            },
        ),
        html.Pre(
            "Edit a cell to see the callback result.",
            id="edit-output",
            style={
                "marginTop": 16,
                "padding": 12,
                "background": "#f5f5f5",
            },
        ),
    ],
    style={
        "maxWidth": 900,
        "margin": "40px auto",
        "fontFamily": "system-ui, sans-serif",
    },
)


@callback(
    Output("edit-output", "children"),
    Input("orders-grid", "afteredit"),
    prevent_initial_call=True,
)
def show_edit(event):
    detail = event["detail"]

    if "prop" not in detail:
        return f"Range edit received: {detail}"

    return (
        f'Row {detail["rowIndex"]}: '
        f'{detail["prop"]} changed to {detail["val"]!r}'
    )


@callback(
    Output("orders-grid", "source"),
    Input("reload-orders", "n_clicks"),
    prevent_initial_call=True,
)
def reload_orders(_clicks):
    return load_orders()


if __name__ == "__main__":
    app.run(debug=True)
Install the dependencies and run it:
python -m pip install dash-datagrid pandas
python app.py
You now have a working, editable Plotly Dash grid backed by Pandas and connected to Python callbacks.
Common Dash data grid problems
The grid is blank
Give the component an explicit height:
style={"height": "60vh", "minHeight": 320}A DataFrame value is not JSON serializable
Normalize dates, missing values, NumPy scalars, Decimal, UUIDs, and custom Python objects before passing them to source.
Every edit sends a very large request
Leave syncSourceOnEdit=False and listen to the compact afteredit event.
A custom Python function does not work inside a column definition
Dash props cross the Python-to-browser boundary as JSON. JavaScript functions, custom renderer functions, editor constructors, and custom comparator functions cannot be passed inside Python dictionaries.
A before* callback does not cancel the browser action
Dash callbacks run after a network round trip. They can observe RevoGrid before* events, but they cannot synchronously call the browser event's preventDefault().
Where to go next
The first version of a grid should stay simple: define the columns, load JSON-safe rows, and use afteredit for changes.
From there, you can add row grouping, pinned data, reusable column types, event listeners, remote data loading, or advanced modules without replacing the grid.
Continue with:
- the Dash Data Grid guide;
- the RevoGrid component API;
- the events API;
- the filtering guide;
- the sorting guide;
- the performance and virtual scrolling guide;
- the RevoGrid demos.
For Python teams, the important part is that RevoGrid does not turn the grid into a Python rendering problem. Dash owns the application logic. RevoGrid owns the data-grid viewport. The two communicate through small, explicit props and events.
That makes RevoGrid a strong starting point for a small editable DataFrame—and a grid you can keep when the Dash app becomes a serious data product.