
It is a web data-grid component with familiar spreadsheet interactions such as cell editing, keyboard navigation, range selection, copy and paste, formulas, autofill, validation, and export. Unlike a full spreadsheet application, it keeps your database, API, permissions, and business workflow in control.
Build a High-Performance Excel-Like Data Grid in JavaScript
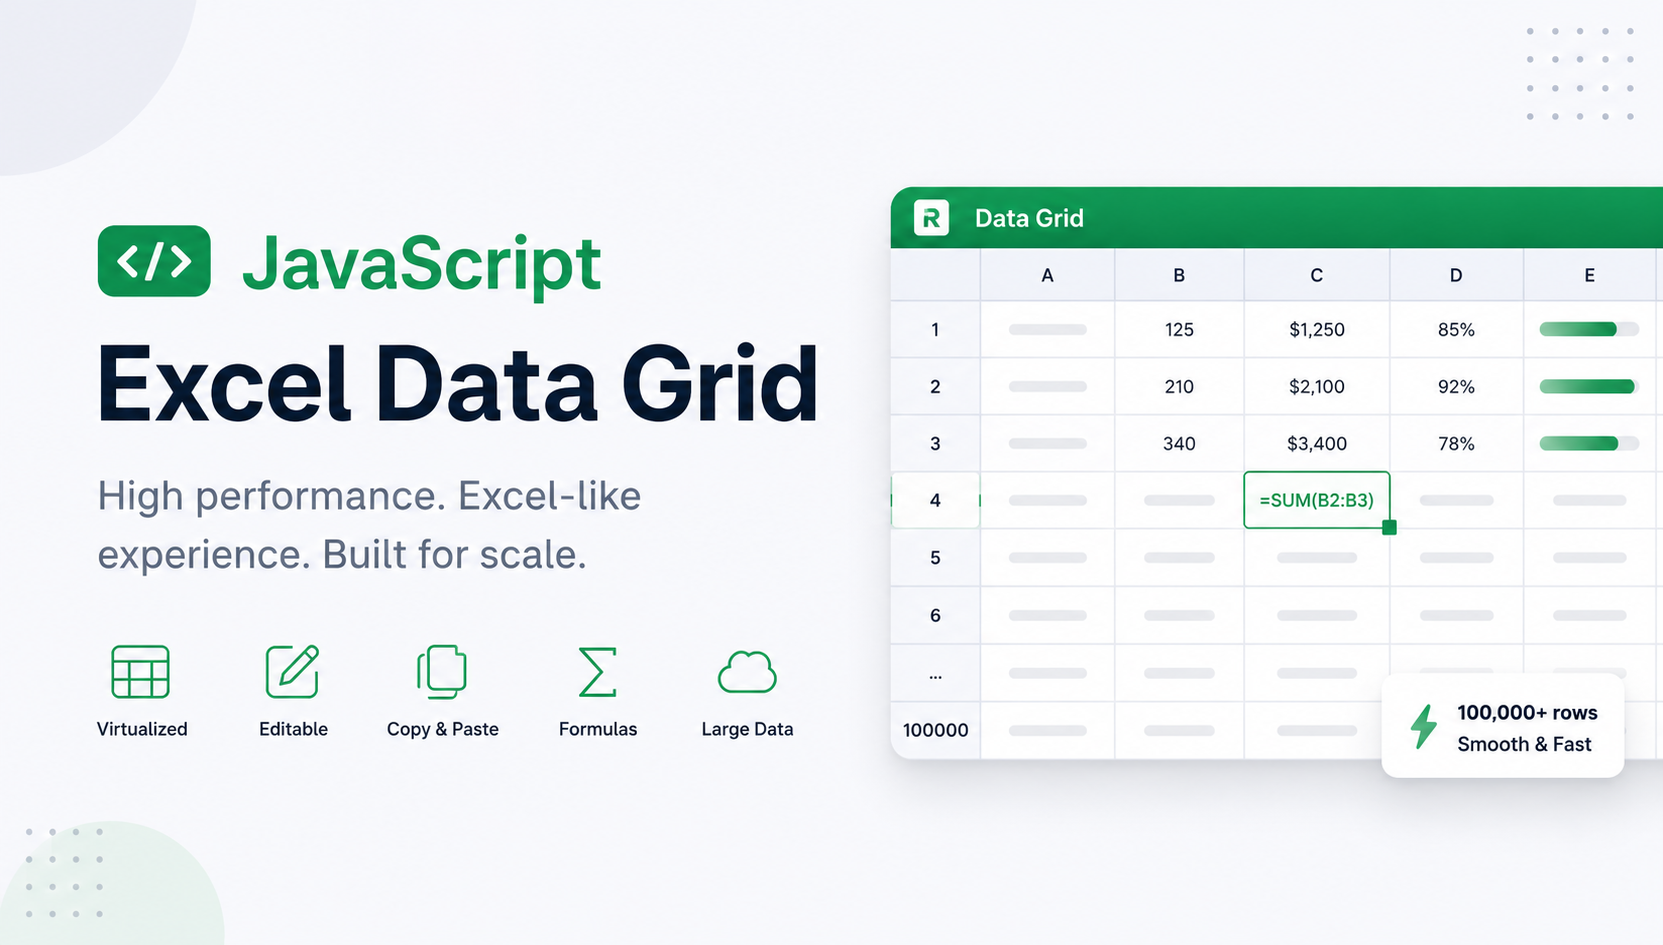
A high-performance JavaScript Excel data grid should give users the interactions they already understand from Excel without turning your web application into a spreadsheet file editor.
Users should be able to edit with the keyboard, select ranges, paste blocks from Excel, filter thousands of records, and keep scrolling without the interface becoming sluggish. Your application should still own the database, permissions, validation, calculations, API calls, and product-specific workflow.
That combination is harder than rendering a table. It requires a grid architecture built for both spreadsheet-like interaction and large-data performance.
Quick answer: Use a virtualized data grid that renders only the visible rows and columns, keeps data updates incremental, and exposes editing and clipboard events to your application. Start with the MIT-licensed RevoGrid Core for the performance and editing foundation, then add RevoGrid Pro when you need formulas, autofill, formatting, history, collaboration, or Excel export.
This guide explains the architecture, provides a working JavaScript example with 100,000 rows, and shows how to add the Excel-like features that production applications actually need.
What is a JavaScript Excel data grid?
A JavaScript Excel data grid is an interactive table component that combines the structure of a data grid with familiar spreadsheet behavior.
A production grid typically combines virtual scrolling, editing, keyboard navigation, range selection, copy and paste, filtering, sorting, pinned rows, pinned columns, and application-owned validation. Spreadsheet-heavy products can add formulas, autofill, undo and redo, formatting, and Excel export.
The important distinction is who owns the data and workflow.
In a spreadsheet application, the workbook is usually the product. Users control sheets, cell positions, formulas, and document structure.
In a product data grid, the application remains in control. A row may represent an invoice, customer, task, inventory item, or financial record. The grid is the interaction layer over application-owned data.
| Component | Best suited to | Main limitation |
|---|---|---|
| HTML table | Small, mostly read-only datasets | No built-in virtualization, editing model, range selection, or spreadsheet workflow |
| Basic data grid | Sorting, filtering, and standard CRUD screens | May not provide deep keyboard, clipboard, formula, or workbook behavior |
| Full spreadsheet component | Workbook-like products where sheets and formulas are the primary model | Can be unnecessarily document-centric for an application backed by an API or database |
| Excel-like data grid | SaaS, operations, reporting, planning, and admin products that need spreadsheet fluency | Requires a deliberate boundary between grid state and application state |
For a product-focused implementation, see the RevoGrid Excel Data Grid overview.
Render millions of cells with virtualization
Imagine a planning screen with 100,000 rows and 50 columns. That dataset contains five million logical cells.
Trying to create a DOM element for every cell would produce far more browser work than the user can see or interact with. It increases layout work, memory pressure, event overhead, and the cost of every update.
A high-performance grid uses virtualization instead:
- Keep the complete logical data model, or the currently loaded server window, in application memory.
- Calculate which rows and columns intersect the viewport.
- Render only those visible cells plus a small buffer.
- Reuse and recombine the rendered view as the user scrolls.
- Apply edits to targeted cells or rows instead of rebuilding the entire grid.
This architecture separates the logical dataset size from the rendered DOM size. A grid may represent millions of logical cells while only mounting the cells required for the current viewport.
Choose the features your application needs
A long feature list is less useful than understanding which layer should own each responsibility.
| Capability | Why it matters | RevoGrid layer |
|---|---|---|
| Row and column virtualization | Keeps rendering work tied to the viewport rather than total dataset size | MIT Core |
| Cell editing and keyboard navigation | Supports fast data-entry workflows | MIT Core |
| Range selection and clipboard | Lets users move tabular data between the app and Excel | MIT Core |
| Sorting and filtering | Makes large datasets explorable | MIT Core |
| Pinned rows and columns | Keeps identifiers and totals visible | MIT Core |
| Custom cells and editors | Adapts the grid to product-specific data types | MIT Core |
| Edit and paste events | Connects validation, permissions, persistence, and analytics | MIT Core |
| Formulas and formula tooling | Adds calculated spreadsheet-style workflows | Pro |
| Smart autofill and preview | Extends sequences and repeated values efficiently | Pro |
| Undo, redo, and audit workflows | Makes dense editing safer and reviewable | Pro |
| Rich formatting and Excel-compatible clipboard | Preserves more spreadsheet context | Pro |
| XLSX export and CSV import | Connects browser workflows with workbook-based processes; applications parse .xlsx imports | Pro |
| Collaboration and presence | Supports shared operational workspaces | Pro |
The grid should not hide this boundary. A team that needs only fast rendering, editing, and clipboard behavior can stay on Core. A team building a spreadsheet-heavy product can add the advanced modules without replacing the underlying grid.
Build a high-performance JavaScript data grid
The following example creates an editable forecast grid with 100,000 rows. It uses plain JavaScript so the same architecture is visible before adding a React, Vue, Angular, or Svelte wrapper.
1. Install RevoGrid
bash
npm install @revolist/revogridSee the installation guide for pnpm, Yarn, Bun, CDN, and standalone-module options.
2. Add the grid element
html
<div class="forecast-workspace">
  <revo-grid id="forecast-grid"></revo-grid>
</div>

<style>
  .forecast-workspace {
    min-width: 0;
    width: 100%;
  }

  #forecast-grid {
    display: block;
    width: 100%;
    height: 640px;
  }
</style>

<script type="module" src="/src/main.js"></script>
A fixed or flex-constrained height is important because the grid needs a viewport to virtualize.
3. Define stable columns and source data
js
// src/main.js
import { defineCustomElements } from '@revolist/revogrid/loader';

defineCustomElements();

const regions = ['EMEA', 'AMER', 'APAC'];
const statuses = ['Draft', 'Reviewed', 'Approved'];

const source = Array.from({ length: 100_000 }, (_, index) => ({
  id: index + 1,
  region: regions[index % regions.length],
  account: `Account ${String(index + 1).padStart(6, '0')}`,
  units: 10 + (index % 500),
  unitPrice: 20 + (index % 80),
  status: statuses[index % statuses.length],
}));

const columns = [
  {
    prop: 'id',
    name: 'ID',
    size: 90,
    readonly: true,
    pin: 'colPinStart',
  },
  {
    prop: 'region',
    name: 'Region',
    size: 120,
    sortable: true,
  },
  {
    prop: 'account',
    name: 'Account',
    size: 220,
    sortable: true,
  },
  {
    prop: 'units',
    name: 'Units',
    size: 110,
  },
  {
    prop: 'unitPrice',
    name: 'Unit price',
    size: 130,
  },
  {
    prop: 'status',
    name: 'Status',
    size: 130,
  },
];

const grid = document.querySelector('#forecast-grid');

if (!grid) {
  throw new Error('Forecast grid element was not found.');
}

Object.assign(grid, {
  columns,
  source,
  rowHeaders: true,
  range: true,
  filter: true,
  resize: true,
  frameSize: 1,
  theme: 'compact',
  useClipboard: {
    rangeFill: true,
  },
});
This gives the page:
- virtualized rows and columns
- an editable cell model
- keyboard navigation
- range selection
- sorting and filtering
- a pinned identifier column
- copy and paste compatible with tabular spreadsheet data
- spreadsheet-style fill when one copied value is pasted into a selected range
The arrays are created once and assigned once. That stability matters: recreating columns or replacing the full source after every cell edit can erase much of the benefit of an optimized grid.
Validate and persist edits
An editable data grid becomes part of the application only when edits flow through product rules.
Use beforeedit and afteredit to connect the grid to application validation and persistence. beforeedit can reject or normalize a value before it is committed; afteredit receives the accepted change after Core applies it.
js
const pendingChanges = [];
let flushTimer = 0;

function isInvalidNumber(prop, val) {
  return (prop === 'units' || prop === 'unitPrice') && Number(val) < 0;
}

grid.addEventListener('beforeedit', event => {
  const { prop, val } = event.detail;

  if (isInvalidNumber(prop, val)) {
    event.preventDefault();
    return;
  }

  if (prop === 'account') {
    event.detail.val = String(val).trim();
  }
});

grid.addEventListener('beforerangeedit', event => {
  const containsInvalidValue = Object.values(event.detail.data).some(values =>
    Object.entries(values).some(([prop, val]) => isInvalidNumber(prop, val)),
  );

  if (containsInvalidValue) {
    event.preventDefault();
  }
});

grid.addEventListener('afteredit', event => {
  const detail = event.detail;

  if ('data' in detail) {
    for (const [rowIndex, values] of Object.entries(detail.data)) {
      const model = detail.models[Number(rowIndex)];

      if (!model) {
        continue;
      }

      for (const [field, value] of Object.entries(values)) {
        queueChange({ id: model.id, field, value });
      }
    }
    return;
  }

  queueChange({
    id: detail.model.id,
    field: detail.prop,
    value: detail.val,
  });
});

function queueChange(change) {
  pendingChanges.push(change);
  window.clearTimeout(flushTimer);
  flushTimer = window.setTimeout(flushChanges, 250);
}

async function flushChanges() {
  const changes = pendingChanges.splice(0);

  if (!changes.length) {
    return;
  }

  try {
    const response = await fetch('/api/forecast/batch', {
      method: 'PATCH',
      headers: {
        'Content-Type': 'application/json',
      },
      body: JSON.stringify({ changes }),
    });

    if (!response.ok) {
      throw new Error(`Save failed with status ${response.status}`);
    }
  } catch (error) {
    pendingChanges.unshift(...changes);
    console.error('Could not save forecast changes:', error);
  }
}
afteredit reports single-cell edits as { model, prop, val } and range edits as row-indexed data and models maps. Handling both shapes lets paste and autofill share the same persistence queue. Batching then prevents a spreadsheet-like interaction from producing one network request per changed cell.
A production implementation should also define retry, conflict, rollback, and user-notification behavior. The grid provides the events; the application owns the business decision.
Copy and paste between Excel and the browser
Clipboard behavior is one of the most important differences between a table and an Excel-like data grid.
RevoGrid Core can copy selected cells as tab-separated rows, which makes the data compatible with Excel and other spreadsheet applications. When users paste, the grid applies the clipboard matrix starting from the focused cell.
Enable range selection for block operations:
js
grid.range = true;Enable one-value-to-range fill behavior:
js
grid.useClipboard = {
  rangeFill: true,
};
The clipboard lifecycle is observable. You can use events such as beforepaste, beforepasteapply, and afterpasteapply to reject a paste, transform values, enforce permissions, or trigger persistence after the range is applied.
For workflows where pasted rows should extend the current dataset, Core also provides AutoAddRowsPlugin:
js
import { AutoAddRowsPlugin } from '@revolist/revogrid';

grid.plugins = [AutoAddRowsPlugin]; // Include alongside any other plugins.
Applications still own column definitions. Automatically inventing new columns from pasted data would bypass the types, editors, validation rules, permissions, and formatting associated with each application field.
Read the complete clipboard operations guide for copy, paste, cut, range fill, and paste-event patterns.
Add formulas, autofill, history, formatting, and Excel export
The previous example uses the MIT-licensed Core. Spreadsheet-heavy applications can add focused RevoGrid Pro modules without replacing the grid.
js
import '@revolist/revogrid-pro/dist/revogrid-pro.css';

import {
  AutoFillPlugin,
  AutoFillPreviewPlugin,
  DataGridFormattingPlugin,
  EventManagerPlugin,
  ExportExcelPlugin,
  FormulaPlugin,
  HistoryPlugin,
} from '@revolist/revogrid-pro';

grid.eventManager = {
  applyEventsToSource: true,
};

grid.plugins = [
  EventManagerPlugin,
  FormulaPlugin,
  AutoFillPlugin,
  AutoFillPreviewPlugin,
  HistoryPlugin,
  DataGridFormattingPlugin,
  ExportExcelPlugin,
];
You can then provide formula values inside the data model:
js
grid.columns = [
  { prop: 'quantity', name: 'Quantity' },
  { prop: 'unitPrice', name: 'Unit price' },
  { prop: 'total', name: 'Total', readonly: true },
];

grid.source = [
  {
    quantity: 12,
    unitPrice: 19.5,
    total: '=A1*B1',
  },
  {
    quantity: 8,
    unitPrice: 27,
    total: '=A2*B2',
  },
];
Trigger an .xlsx export from an application button:
html
<button id="export-forecast" type="button">Export forecast</button>js
document
  .querySelector('#export-forecast')
  ?.addEventListener('click', () => {
    grid.dispatchEvent(
      new CustomEvent('export-excel', {
        detail: {
          workbookName: 'forecast.xlsx',
          sheetName: 'Forecast',
        },
      }),
    );
  });
The modules solve different problems:
FormulaPluginevaluates Excel-like formulas.AutoFillPluginextends values and sequences.AutoFillPreviewPluginshows the predicted result before users commit a fill.HistoryPluginadds undo and redo infrastructure.DataGridFormattingPluginsupports richer spreadsheet formatting and clipboard workflows.ExportExcelPluginprepares and exports workbook data.
ExportExcelPlugin imports CSV files and exports .xlsx workbooks. Importing an existing .xlsx or .xls workbook remains application-owned: parse it with your chosen workbook library, map the result to row objects, and assign the normalized rows to source.
This modular model avoids forcing every application to carry spreadsheet behavior it does not use.
Explore the complete RevoGrid Pro documentation or start with the 30-day Pro trial.
Keep large datasets responsive
Virtualization is necessary, but it is not sufficient. A poorly designed application can make a fast grid slow by putting expensive work around it.
Keep virtualization enabled
RevoGrid virtualizes rows and columns by default. Disable vertical or horizontal virtualization only when the corresponding dimension is genuinely small and stable.
The frameSize property controls the off-screen buffer:
js
grid.frameSize = 1;A value of 1 is a practical starting point. Increase it gradually if very fast scrolling exposes temporary blanking with expensive custom cells. Lower values reduce off-screen rendering.
Keep source and columns stable
Treat full source replacement as loading a new dataset, not as the default response to a cell edit. Apply an incremental grid change and sync a patch or batch instead. Replace the complete source only when the dataset changes, such as after a page switch, server refresh, filter result, or externally authored row insertion or removal.
Use targeted updates
When application code needs to change one cell, use the setDataAt targeted update method rather than rebuilding the dataset:
js
await grid.setDataAt({
  row: 12,
  col: 4,
  val: 98.5,
});
Targeted updates are particularly valuable for live prices, operational statuses, progress values, validation results, and collaborative changes.
Keep cell renderers inexpensive
A custom cell renderer may execute many times while the viewport changes. Avoid:
- network requests inside cell rendering
- filtering or sorting large arrays per cell
- repeatedly creating heavy framework component trees
- unnecessary images, charts, or layout measurements in every visible cell
- formatting work that could be precomputed once
A virtualized grid limits how many cells exist, but expensive visible cells are still expensive.
Batch application work
A user can edit one cell, paste 500 cells, or fill 10,000 cells. Your persistence and analytics layers should be able to process transactions or batches rather than assuming every action changes exactly one value.
Measure your real workload
A benchmark with plain text cells does not predict a grid filled with dropdowns, charts, validators, conditional styles, and framework components. Test the same row count, column count, renderers, pinned regions, editors, and update patterns used by your product.
See the RevoGrid performance and virtualization guide for the full checklist.
Verify performance with the 100,000-row benchmark
RevoGrid publishes a reproducible local benchmark using 100,000 rows and 100 columns, or 10 million logical cells. The run was recorded on July 5, 2026 against a documented browser, machine, dataset, and renderer configuration.
| Metric | Published result |
|---|---|
| Logical dataset | 100,000 rows × 100 columns |
| Total logical cells | 10,000,000 |
| Initial render | 34.10 ms |
| Scrolling | 60 FPS normalized to a 60 Hz target |
| Dropped frames in scripted pass | 2 |
| Rendered viewport rows after warmup | 60 |
| Rendered data cells after warmup | 260 |
| DOM nodes in the benchmark document | 807 |
| Targeted edit latency, p95 | 0.10 ms |
| Heap after warmup | 445.84 MiB median |
| Heap after interaction loop | 482.06 MiB median |
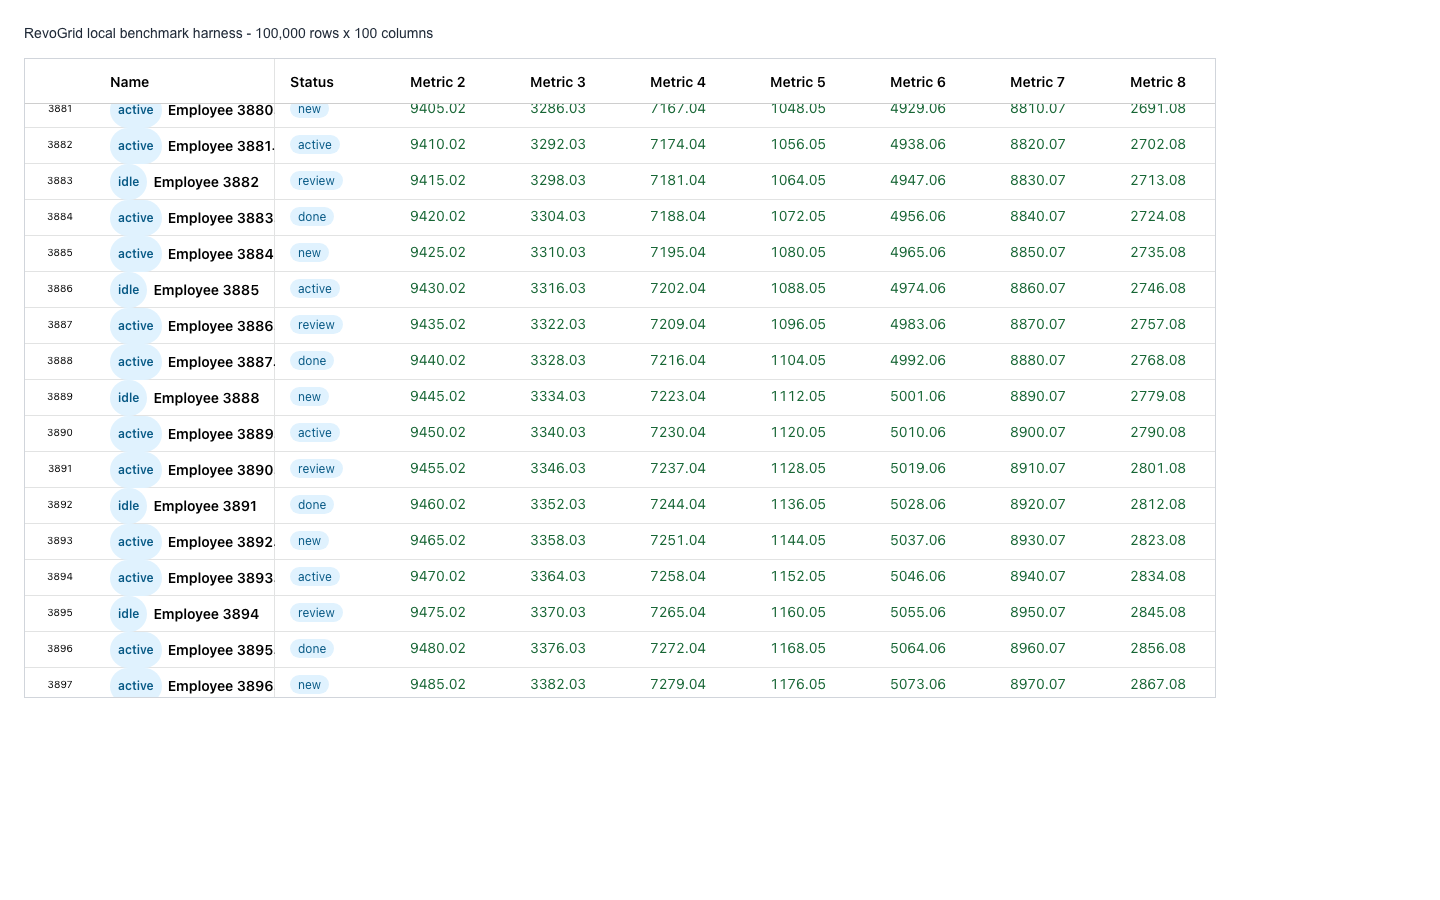
These numbers are not a universal guarantee. Data generation was excluded from the initial-render metric, and results vary with hardware, browser, refresh rate, cell complexity, application code, and measurement method.
The useful part is not a single headline number. It is the documented relationship between 10 million logical cells and a much smaller rendered viewport. Review the complete methodology, raw results, screenshot, and video on the RevoGrid benchmark page.
Choose local or server-side data
Virtualization answers a rendering question: how many cells should exist in the DOM?
It does not answer a data-architecture question: how much data should the browser download and own?
Keeping 100,000 rows in the browser can be appropriate when:
- the payload is compact
- users need instant local exploration
- client-side filtering and sorting are valuable
- the machine and memory budget are known
- the data is already available locally
Server-side data is usually better when:
- the dataset contains millions of records
- rows are permission-sensitive
- queries require database indexes or aggregations
- the data changes continuously on the server
- loading the full payload delays the first useful screen
- mobile or low-memory devices matter
Use server paging when users think in stable pages. Use infinite loading when scrolling through a continuous result set is more natural. Send filter and sort state to the server when the operation must apply to records that are not currently loaded.
Read server-side data guidance and data loading and synchronization patterns before choosing the ownership model.
Use RevoGrid with React, Vue, Angular, or Svelte
RevoGrid's core is a Web Component. Its React, Vue, Angular, and Svelte wrappers expose the same grid engine through each ecosystem's component model.
Move the stable columns and row generator into a shared module:
ts
export const columns = [
  { prop: 'id', name: 'ID', readonly: true, size: 90 },
  { prop: 'account', name: 'Account', size: 220 },
  { prop: 'amount', name: 'Amount', size: 130 },
  { prop: 'status', name: 'Status', size: 130 },
];

export function createRows(count: number) {
  return Array.from({ length: count }, (_, index) => ({
    id: index + 1,
    account: `Account ${index + 1}`,
    amount: 1000 + (index % 5000),
    status: index % 2 ? 'Open' : 'Reviewed',
  }));
}
Install the wrapper for your framework:
bash
npm install @revolist/react-datagridbash
npm install @revolist/vue3-datagridbash
npm install @revolist/angular-datagridbash
npm install @revolist/svelte-datagridThen bind the same columns and source through the wrapper. Each example creates the large array only once instead of rebuilding it during a framework render cycle.
tsx
import { useState } from 'react';
import { RevoGrid } from '@revolist/react-datagrid';
import { columns, createRows } from './forecast-data';

export default function ForecastGrid() {
  const [source] = useState(() => createRows(100_000));

  return (
    <RevoGrid
      style={{ height: 640 }}
      columns={columns}
      source={source}
      rowHeaders
      range
      filter
      resize
    />
  );
}
vue
<script setup lang="ts">
import { shallowRef } from 'vue';
import RevoGrid from '@revolist/vue3-datagrid';
import { columns, createRows } from './forecast-data';

const source = shallowRef(createRows(100_000));
</script>

<template>
  <RevoGrid
    style="height: 640px"
    :columns="columns"
    :source="source"
    row-headers
    range
    filter
    resize
  />
</template>
ts
import { Component } from '@angular/core';
import { RevoGrid } from '@revolist/angular-datagrid';
import { columns, createRows } from './forecast-data';

@Component({
  selector: 'app-forecast-grid',
  standalone: true,
  imports: [RevoGrid],
  template: `
    <revo-grid
      style="height: 640px"
      [columns]="columns"
      [source]="source"
      [rowHeaders]="true"
      [range]="true"
      [filter]="true"
      [resize]="true"
    ></revo-grid>
  `,
})
export class ForecastGridComponent {
  readonly columns = columns;
  readonly source = createRows(100_000);
}
svelte
<script lang="ts">
  import { RevoGrid } from '@revolist/svelte-datagrid';
  import { columns, createRows } from './forecast-data';

  const source = createRows(100_000);
</script>

<RevoGrid
  style="height: 640px"
  {columns}
  {source}
  rowHeaders
  range
  filter
  resize
/>
The same performance rules apply in every integration: keep large inputs stable, use lightweight framework-native renderers, synchronize edits incrementally, and use server-side data when the full dataset should not live in the client.
Continue with the framework-specific setup and customization guides:
- React data grid guide, React renderers, and React editors
- Vue 3 data grid guide, Vue renderers, and Vue editors
- Angular data grid guide, Angular renderers, and Angular editors
- Svelte data grid guide, Svelte renderers, and Svelte editors
- TypeScript guide, plain JavaScript quick start, and standalone Web Component setup
Data grid or full spreadsheet: which should you choose?
“Excel-like” does not always mean “build Excel in the browser.”
Choose an Excel-like data grid when:
- each row maps to a business entity
- your API and database remain authoritative
- columns have known types and permissions
- edits must trigger application rules
- the interface needs custom cells, editors, actions, and status controls
- performance across large row counts matters
- the grid is one part of a larger SaaS or internal application
Choose a full spreadsheet model when:
- the workbook or document is the primary product
- users should create arbitrary sheets and layouts
- cell coordinates are more important than business-field names
- user-authored formulas define most of the domain logic
- compatibility with existing workbook documents is the central requirement
Many B2B products do not need a spreadsheet clone. They need spreadsheet fluency under application control.
Implementation checklist
Before calling an Excel-like grid production-ready, verify the complete workflow:
- Viewport: The grid has a constrained height and row and column virtualization remain enabled.
- Stable inputs: Columns and active source data are not recreated after every small interaction.
- Editing: Read-only and editable fields are explicit.
- Validation: Invalid values can be rejected or normalized before commit.
- Clipboard: Multi-cell paste has defined validation, permission, and persistence behavior.
- Synchronization: Single edits, range edits, paste, and autofill can be saved as patches or batches.
- Failure handling: The UI defines retry, rollback, conflict, and user-notification behavior.
- Performance: Custom cells are measured with realistic data and interaction patterns.
- Remote data: The browser loads only the data it should own.
- Accessibility: Keyboard navigation, focus, labels, contrast, and screen-reader behavior are tested in the final product context.
- Export: Exported fields and formulas follow the same permissions as the visible application.
- Security: Pasted, rendered, and exported content is treated as untrusted application data.
Start building
Start with RevoGrid Core for virtualized rendering, editing, clipboard, filtering, and customization. Add RevoGrid Pro only when the application needs formulas, autofill, formatting, history, collaboration, or Excel export.
- Explore the Excel Data Grid for JavaScript applications.
- Run the interactive RevoGrid demos.
- Review the large-data benchmark and methodology.
- Follow the JavaScript Data Grid quick start.
- Evaluate the advanced modules with the 30-day RevoGrid Pro trial.
FAQ