
The Best Data Grids for Python Dash in 2026
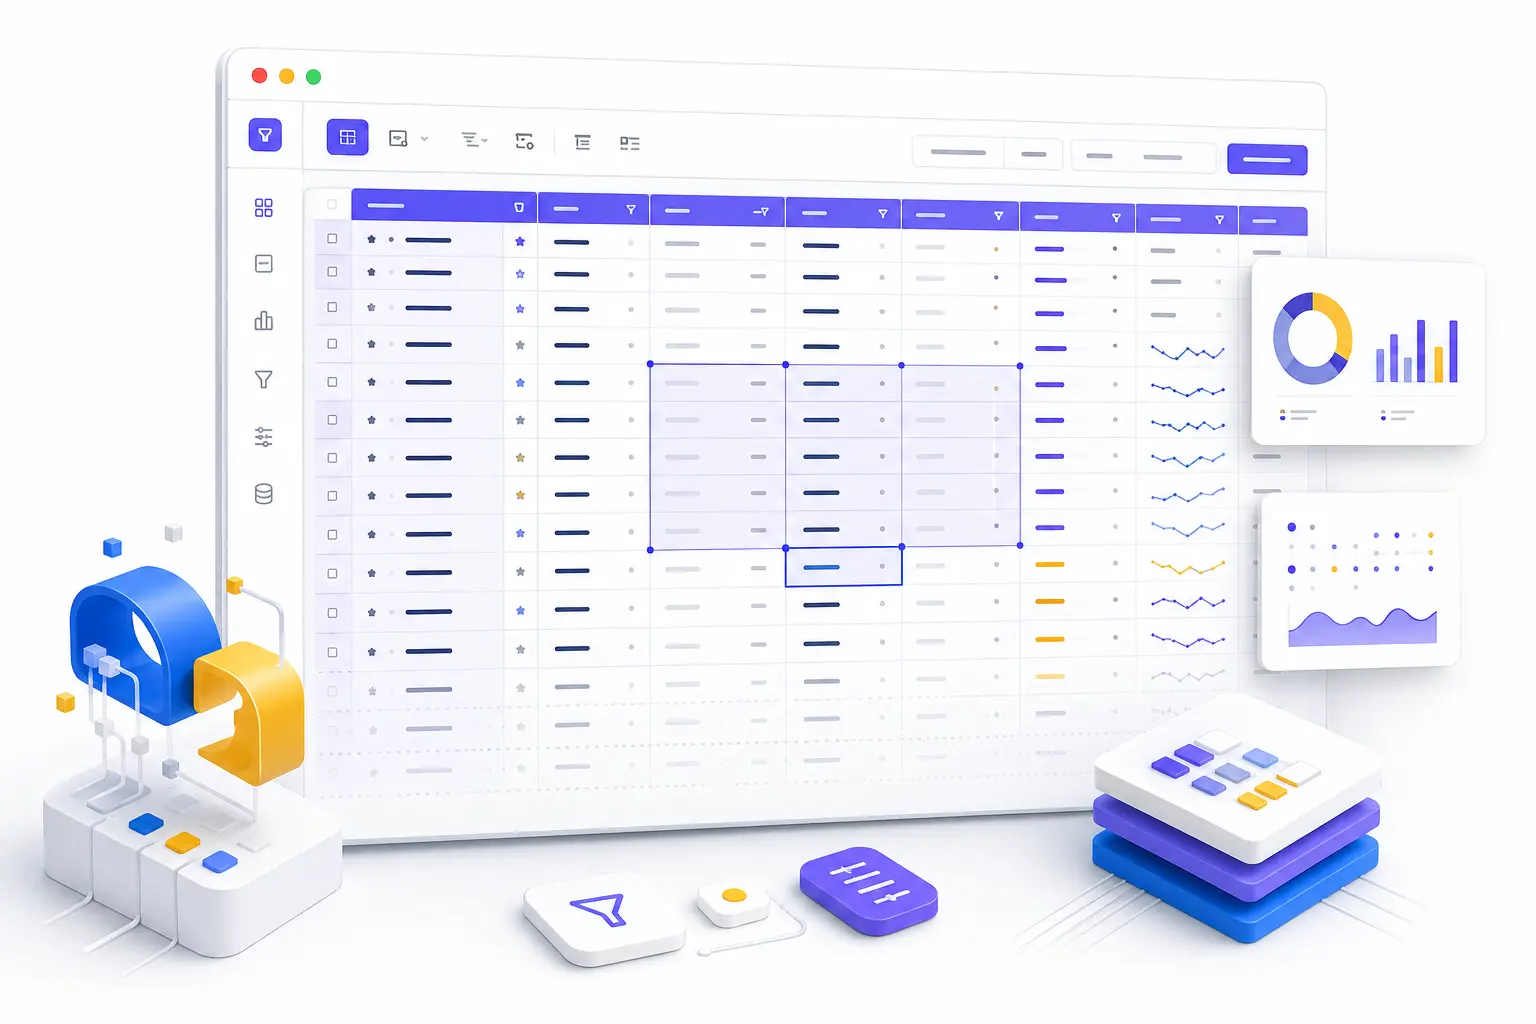
Dash makes it remarkably easy to turn Python data into an interactive web application. The table is often where that simplicity ends.
A basic table is enough when users only need to read a few rows. But many Dash apps quickly become working tools: users sort and filter results, edit assumptions, paste data from Excel, select ranges, review thousands of records, and expect changes to flow back into Python.
At that point, the choice of data grid matters.
This guide compares the strongest options available to Dash developers in 2026:
We will compare performance, editing, Python callbacks, licensing, feature depth, and how each grid feels once a prototype grows into a real product.
The short answer
| Rank | Dash grid | Best for |
|---|---|---|
| 1 | RevoGrid for Dash | Fast, editable data apps that need an MIT core and room to grow |
| 2 | Dash AG Grid | Enterprise applications that need the broadest feature set |
| 3 | Dash Glide Grid | Canvas-based, spreadsheet-like experiences with rich cell types |
| 4 | Dash DataTable | Maintaining an existing Dash application during migration |
| 5 | Dash Tabulator | Smaller projects that only need a basic Tabulator wrapper |
There is no universal winner for every application. Dash AG Grid has a larger enterprise feature set. Dash Glide Grid is interesting when canvas rendering fits the product. Existing applications may still depend on Dash DataTable.
For a new data-heavy Dash app, however, RevoGrid offers the best overall balance of performance, editing, open-source licensing, and Python integration.
What should a good Dash data grid provide?
A Dash grid sits between two very different environments.
In the browser, it must scroll smoothly, manage focus, respond to keyboard input, edit cells, and update only the visible part of a large dataset. In Python, it must expose clean properties and events that work naturally with Dash callbacks.
That makes the following questions more useful than a long feature checklist:
- Does the grid virtualize both rows and columns?
- Can users edit cells and paste ranges without a server round trip for every visual action?
- Does a cell change produce a compact event, or resend the entire dataset?
- Can it handle a Pandas DataFrame without awkward conversion code?
- Are sorting, filtering, selection, and resizing included?
- Which important features require a commercial license?
- Is the Dash wrapper actively maintained alongside the underlying JavaScript grid?
- Can the grid grow from a dashboard table into the main workspace of the application?
These differences are easy to overlook in a ten-row demo. They become obvious with 100,000 rows, frequent edits, or several people working in the application every day.
Feature comparison
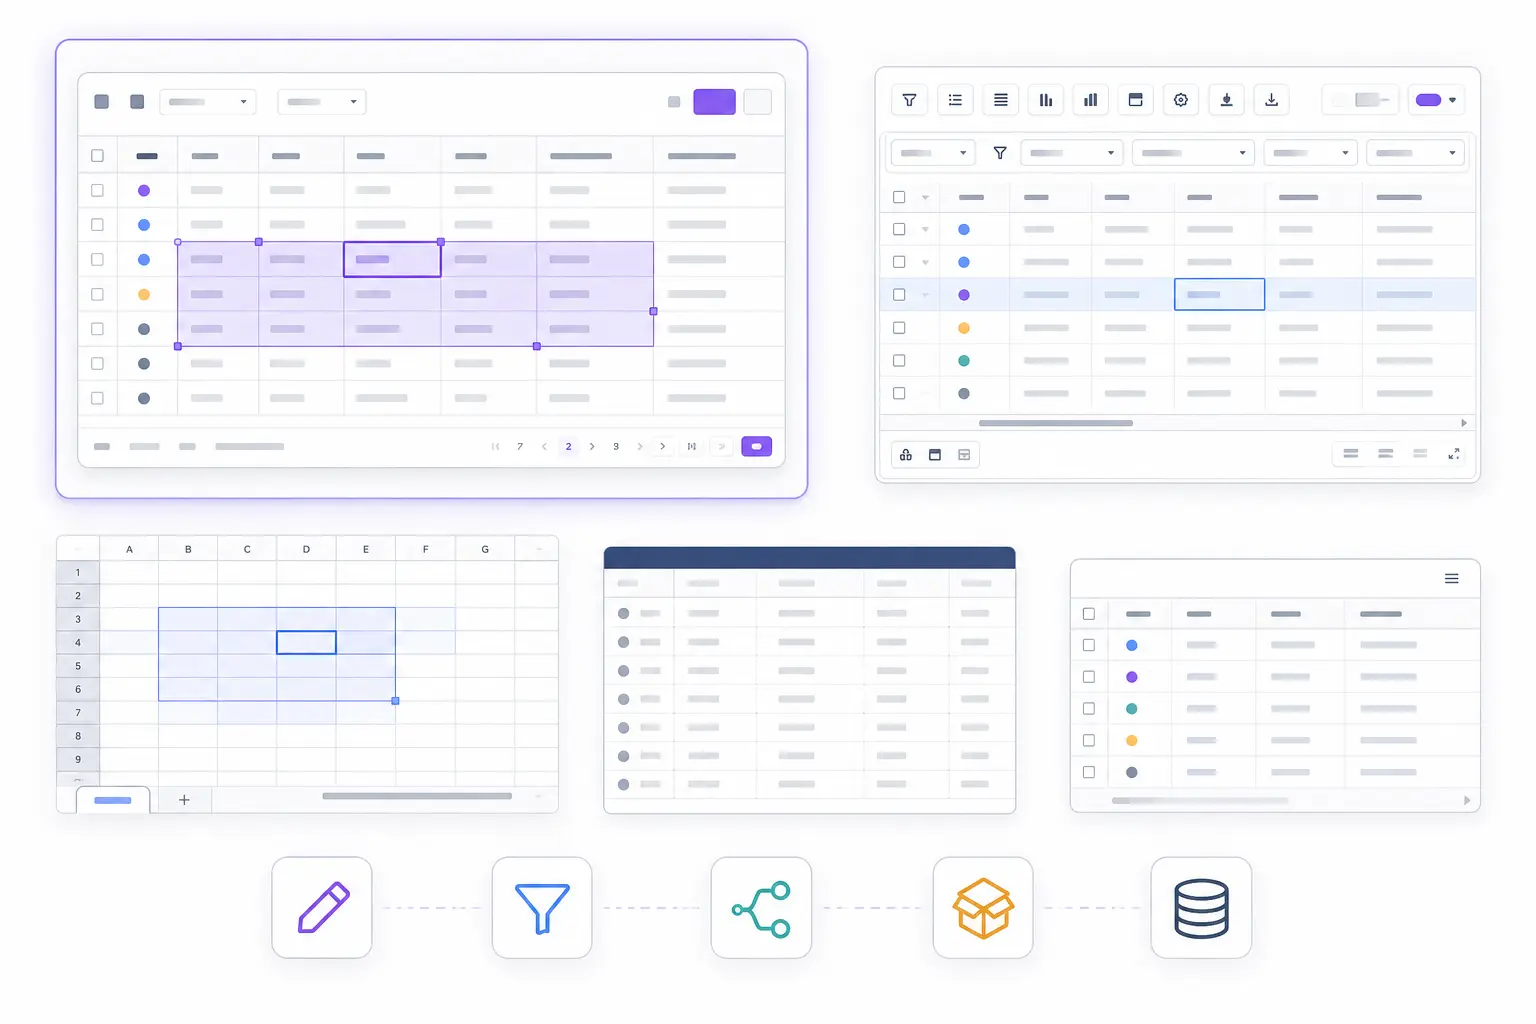
| Grid | Rendering | Editing and clipboard | Dash callbacks | Open-source option | Main trade-off |
|---|---|---|---|---|---|
| RevoGrid for Dash | Virtualized rows and columns | Editing, range selection, copy/paste, range fill | Named events and a generic event stream | MIT Core | Some advanced and browser-function APIs sit outside the Python-only boundary |
| Dash AG Grid | Virtualized DOM with several row models | Mature editing and selection | Extensive Dash property model | Community edition | Many advanced features require AG Grid Enterprise |
| Dash Glide Grid | Canvas | Spreadsheet-style editing, fill handle, copy/paste | Dash event properties | MIT | Smaller and newer Dash ecosystem; canvas changes DOM customization |
| Dash DataTable | Table virtualization | Basic editable-table workflows | Native Dash properties | Included with Dash | Deprecated and due to leave the core API in Dash 5.0 |
| Dash Tabulator | Virtual DOM through Tabulator | Basic wrapper coverage | Limited Dash integration | MIT | Wrapper does not expose the full underlying Tabulator API |
1. RevoGrid for Dash
RevoGrid for Dash is the official Python Dash integration for RevoGrid. It packages the grid's browser bundle with a generated Python component, so a normal Dash application only needs one Python package:
pip install dash-datagridThe Python import is deliberately small:
from dash_datagrid import RevoGridRevoGrid was built for dense, interactive data applications rather than static reporting tables. Its virtualized viewports render the visible rows and columns instead of building a DOM element for every logical cell. That makes it a strong fit for operational dashboards, scientific tools, financial applications, admin systems, and Python products where the grid becomes a real workspace.
Why it ranks first
RevoGrid's Core is MIT-licensed and includes the features most Dash applications need to get beyond a simple table:
- virtual scrolling for large row and column counts
- inline editing
- range selection
- copy and paste
- optional range fill
- sorting and filtering
- row grouping
- pinned rows and columns
- column resizing and reordering
- keyboard navigation
- export support
- light, dark, and custom themes
- compact event payloads for Dash callbacks
The last point is particularly important.
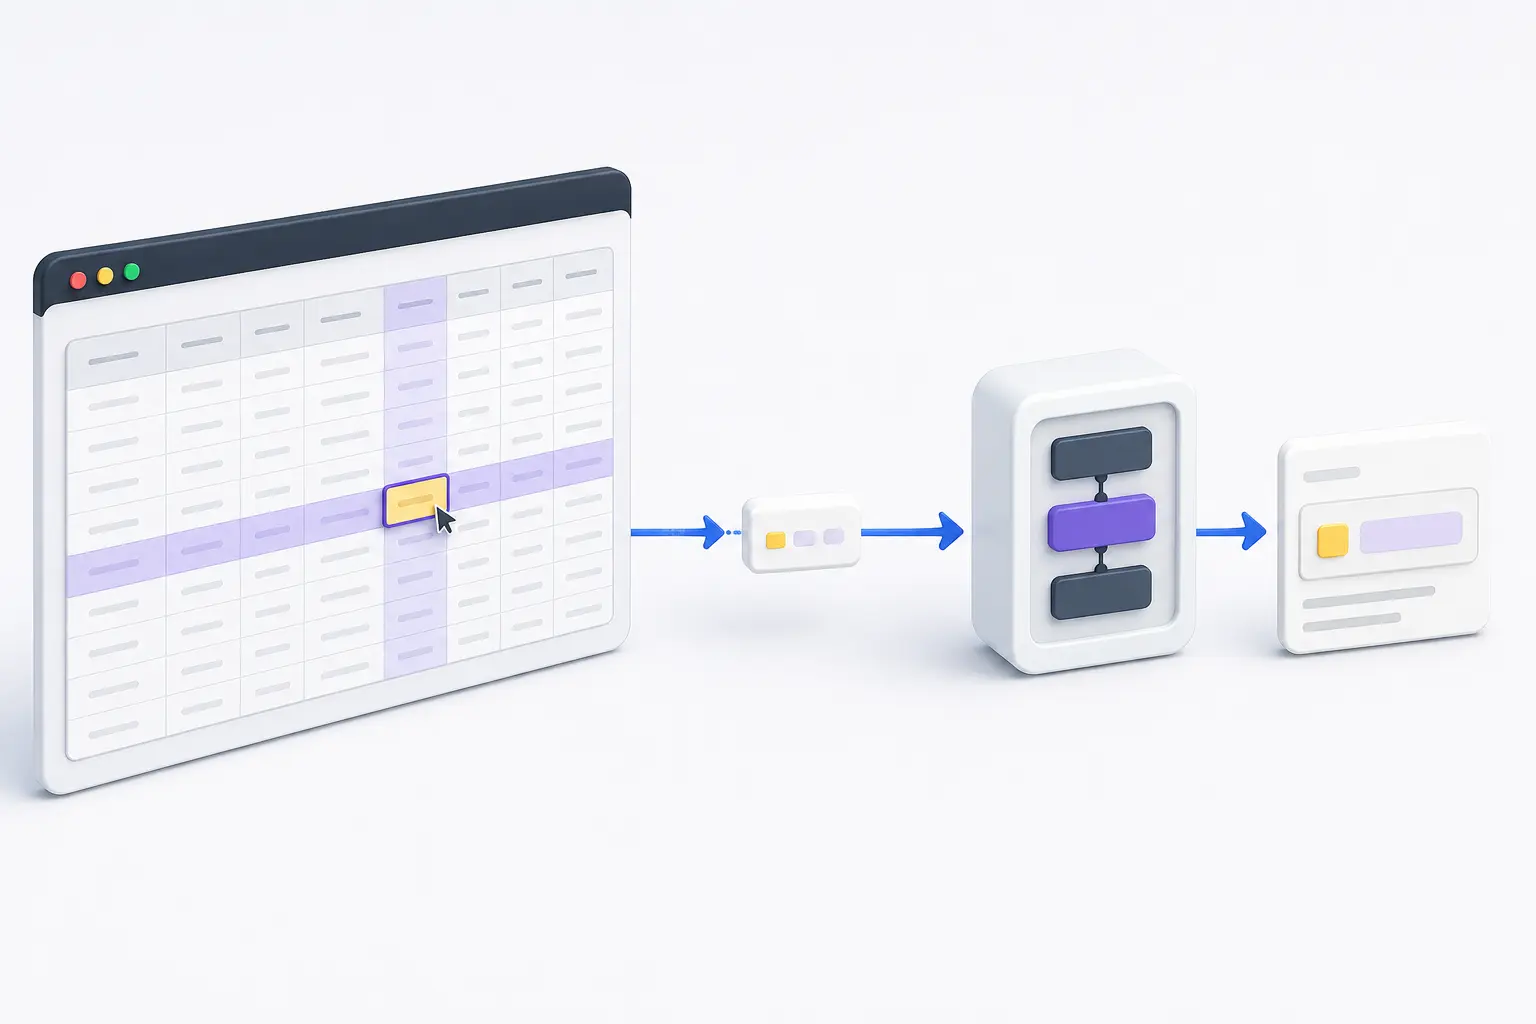
By default, editing a cell updates the browser immediately and sends a compact afteredit event to Python. The grid does not need to clone and return the full source after every edit. For a large dataset, that is a much healthier default than moving thousands of unchanged rows between the browser and the Dash server.
A working RevoGrid Dash example
Save the following as app.py:
from dash import Dash, Input, Output, callback, html
from dash_datagrid import RevoGrid


app = Dash(__name__)

rows = [
    {"order": "A-100", "customer": "Ada", "status": "Open", "amount": 120},
    {"order": "A-101", "customer": "Grace", "status": "Paid", "amount": 85},
    {"order": "A-102", "customer": "Linus", "status": "Open", "amount": 210},
]

columns = [
    {
        "prop": "order",
        "name": "Order",
        "readonly": True,
        "size": 120,
    },
    {
        "prop": "customer",
        "name": "Customer",
        "sortable": True,
        "size": 180,
    },
    {
        "prop": "status",
        "name": "Status",
        "sortable": True,
        "filter": "string",
    },
    {
        "prop": "amount",
        "name": "Amount",
        "sortable": True,
        "filter": "number",
    },
]

app.layout = html.Main(
    [
        html.H1("Orders"),
        RevoGrid(
            id="orders-grid",
            source=rows,
            columns=columns,
            rowHeaders=True,
            resize=True,
            range=True,
            useClipboard={"rangeFill": True},
            filter=True,
            style={"height": 420},
        ),
        html.Pre("Edit a cell to see the change.", id="edit-output"),
    ]
)


@callback(
    Output("edit-output", "children"),
    Input("orders-grid", "afteredit"),
    prevent_initial_call=True,
)
def show_edit(event):
    detail = event["detail"]

    if "prop" not in detail:
        return f"Range edit: {detail}"

    return (
        f'Row {detail["rowIndex"]}, {detail["prop"]} '
        f'changed to {detail["val"]!r}'
    )


if __name__ == "__main__":
    app.run(debug=True)
Run it with:
python app.pyThen open the local address printed by Dash, normally http://127.0.0.1:8050.
One small detail is worth remembering: give the grid an explicit height. RevoGrid fills its host, so a missing height is the most common reason a new grid appears blank.
Using a Pandas DataFrame
Dash developers rarely begin with a hand-written list of dictionaries. In most applications, the data already lives in Pandas.
For a DataFrame containing JSON-native values:
rows = frame.to_dict("records")

grid = RevoGrid(
    columns=columns,
    source=rows,
    style={"height": 500},
)
If the DataFrame includes timestamps, NumPy values, or missing values, normalize it through JSON:
import json

rows = json.loads(
    frame.to_json(
        orient="records",
        date_format="iso",
    )
)
This converts timestamps to ISO strings and missing values to JSON null, which Dash can safely serialize.
Where RevoGrid has limits
A Python component cannot carry arbitrary JavaScript functions across the Dash boundary.
RevoGrid properties made from strings, numbers, booleans, lists, and dictionaries work naturally. JavaScript function-based cell renderers, custom editor constructors, comparators, and synchronous event cancellation need a browser-side integration rather than a Python callback.
This is not usually a concern for standard Dash grids. It matters when the design depends on deeply custom JavaScript behavior inside every cell.
Best fit
Choose RevoGrid for Dash when:
- the grid is central to the application
- users need serious editing and clipboard workflows
- large datasets must remain responsive
- you want an MIT-licensed foundation
- compact edit events matter
- the application may later need advanced RevoGrid Pro or Enterprise workflows
2. Dash AG Grid
Dash AG Grid is the official Dash wrapper around AG Grid. It is mature, well documented, and provides the broadest feature surface in this comparison.
If a large organization already uses AG Grid elsewhere, or if a Dash app needs a particular AG Grid feature, this can be the safest institutional choice.
Strengths
- extensive Dash documentation and examples
- mature editing, selection, filtering, and formatting
- client-side and infinite row models in the Community edition
- server-side row model for Enterprise users
- strong ecosystem and a large developer community
- advanced features such as master/detail, aggregation, tree data, and row grouping
The licensing line matters
Dash AG Grid is free to install, and AG Grid Community covers many normal grid requirements. But a meaningful part of its advanced feature set belongs to AG Grid Enterprise.
Enterprise-only capabilities include features such as server-side row grouping, master/detail, advanced aggregation, tree data, and the Enterprise sidebar. That is perfectly reasonable for teams that have budgeted for AG Grid, but it should be understood before the application architecture begins to depend on those features.
The distinction is not simply “free grid versus paid grid.” It is about where your likely future requirements sit on that line.
Best fit
Choose Dash AG Grid when:
- you need the broadest enterprise feature set
- your organization already licenses or standardizes on AG Grid
- its server-side row model matches your data architecture
- mature documentation is more important than a smaller API
- licensing has already been evaluated
Verdict
Dash AG Grid is the strongest alternative to RevoGrid and may be the better choice for a procurement-heavy enterprise project.
RevoGrid is more attractive when you want a simpler MIT foundation, strong editing and virtualization, and a cleaner path from a small Dash app to a custom data product without adopting AG Grid's full ecosystem.
3. Dash Glide Grid
Dash Glide Grid wraps Glide Data Grid for Dash and uses canvas rendering. It is one of the most interesting community options to emerge for Python data apps.
Its strengths are immediately visible in spreadsheet-like workflows:
- fast canvas rendering
- range selection
- copy and paste
- fill handle
- undo and redo
- rich cell types such as dropdowns, images, buttons, and multi-select values
- MIT licensing
Canvas is both its advantage and its main trade-off.
Drawing cells onto a canvas can produce very smooth scrolling across a large visual surface. But cells are not ordinary DOM elements, which changes how CSS customization, browser inspection, accessibility, and embedded interactive content work.
Dash Glide Grid is also newer and has a smaller user base than Dash AG Grid or RevoGrid's underlying grid engine. That does not make it a poor choice, but teams should test the exact editing, callback, accessibility, and deployment workflows they need.
Best fit
Choose Dash Glide Grid when:
- a canvas-based spreadsheet experience fits the product
- rich built-in cell types are a priority
- fill-handle editing is central
- you are comfortable adopting a newer community Dash component
4. Dash DataTable
Dash DataTable helped make interactive tables a standard part of Python Dash apps. It supports editing, filtering, sorting, conditional formatting, dropdowns, and Python callbacks.
For years, it was the obvious first choice because it shipped with Dash and required no separate grid decision.
That is no longer the case.
Plotly has deprecated Dash DataTable and states that it will be removed from the core Dash API in Dash 5.0. Plotly recommends migrating to Dash AG Grid.
This makes DataTable difficult to recommend for a new application in 2026, even if its current feature set appears sufficient. A new app would begin with a known migration ahead of it.
Best fit
Use Dash DataTable when:
- it already exists in a stable application
- the table is small and not changing
- you need time to plan a migration
For new work, start with RevoGrid or Dash AG Grid instead.
5. Dash Tabulator
Dash Tabulator brings the Tabulator JavaScript table into Dash.
Tabulator itself is a capable open-source project with virtual DOM rendering, sorting, filtering, editing, and many table features. The important distinction is that a Dash wrapper does not automatically expose everything available in the underlying JavaScript library.
Dash Tabulator's own package description says it is not a comprehensive implementation and provides the basics needed to use Tabulator in a Dash app.
That makes it useful for modest applications, but less convincing when the grid is expected to support complex selection, clipboard, validation, and long-term product workflows.
Best fit
Choose Dash Tabulator when:
- you already know Tabulator
- the table requirements are limited
- its exposed callback and editing surface covers your complete use case
Which grid should you choose?
The right answer depends on what the table will become.
For a new editable Dash application
Start with RevoGrid for Dash. It gives you a strong open-source core, fast virtualized rendering, spreadsheet-like interaction, and efficient edit callbacks without forcing the whole dataset through Python after every cell change.
For maximum enterprise feature breadth
Choose Dash AG Grid, particularly when the organization already accepts AG Grid Enterprise licensing or requires features specific to its enterprise row models.
For a canvas spreadsheet
Test Dash Glide Grid. It has an appealing editing model and rich cell types, but validate canvas-specific trade-offs against your accessibility and customization requirements.
For an existing Dash DataTable
Do not rewrite a stable application in a panic. But do treat the Dash 5.0 removal notice as a real migration requirement and avoid expanding your dependence on DataTable.
For a simple table
Dash Tabulator can work, although a basic native Dash table may be enough if editing, selection, and large-data performance are not important.
Performance: virtualization is only the beginning
It is common to ask how many rows a Dash grid can handle. The honest answer is that row count alone tells you very little.
A million simple rows is different from 50,000 rows with expensive renderers, frequent updates, complex filters, and callbacks that resend the entire dataset.
When evaluating performance, test:
- initial serialization from Python
- the size of the JSON transferred to the browser
- scrolling in both directions
- filter and sort latency
- editing latency
- callback payload size
- full dataset replacement
- memory use after several reloads
RevoGrid virtualizes rows and columns and can render datasets far larger than the number of cells visible on screen. But the browser still needs to receive any client-side dataset you pass into source.
For truly large or remote data, pair virtualization with a sensible data-loading strategy. Keep filtering, aggregation, or paging on the server when sending the entire dataset to the browser would be wasteful.
A practical migration path from Dash DataTable
If you are replacing Dash DataTable, avoid trying to translate every property one by one.
Instead:
- Identify the real user workflows: reading, editing, filtering, selecting, exporting, or pasting.
- Convert DataFrame records into the new grid's row format.
- Recreate the essential columns first.
- Connect edit and selection events to Dash callbacks.
- Add styling after behavior works.
- Test with production-sized data, not a ten-row sample.
For RevoGrid, the conceptual mapping is straightforward:
| Dash DataTable | RevoGrid for Dash |
|---|---|
data | source |
columns with id | columns with prop |
editable=True | editable by default; use readonly to lock cells |
sort_action | sortable columns and sorting |
filter_action | column filters and filter |
data_timestamp or changed data | afteredit compact event |
| selected cells | range and focus events |
The biggest architectural improvement is usually edit handling. Instead of receiving a full table snapshot and comparing it with the old data, a callback can persist the changed row, property, and value directly.
Final verdict
The Dash data grid landscape is better in 2026 than it was a few years ago.
Dash developers no longer have to choose only between the built-in DataTable and a large enterprise grid. RevoGrid and newer community projects have brought serious virtualization, editing, clipboard behavior, and modern grid UX into Python applications.
Our recommendation is:
- RevoGrid for Dash for the best overall balance.
- Dash AG Grid for maximum enterprise depth.
- Dash Glide Grid for canvas-based spreadsheet experiences.
- Dash DataTable only while maintaining or migrating existing apps.
- Dash Tabulator for smaller, limited integrations.
RevoGrid ranks first because it covers the part of the market that many Dash teams actually need: more capable than a table, less commercially restrictive than an enterprise-only stack, fast with large data, and practical to connect to Python.
Install it with:
pip install dash-datagridThen continue with the RevoGrid Dash guide, explore the complete grid API, review editing, filtering, and performance, or open the interactive RevoGrid demos.
Frequently asked questions
What is the best data grid for Python Dash?
RevoGrid for Dash is the best overall choice for a new editable, performance-sensitive Dash application. Dash AG Grid is the strongest alternative when enterprise feature breadth is the main requirement.
Is RevoGrid for Dash open source?
Yes. RevoGrid Core and the official dash-datagrid package use the MIT license. Advanced RevoGrid Pro and Enterprise functionality is commercially licensed.
Does RevoGrid work with Pandas?
Yes. Convert a DataFrame using frame.to_dict("records"), or normalize complex DataFrames through frame.to_json(orient="records", date_format="iso").
Can I receive cell edits in a Dash callback?
Yes. Use the grid's afteredit property as a Dash callback input. It returns a JSON-safe event containing details such as the row index, column property, and new value.
Is Dash DataTable still supported?
Dash DataTable is deprecated. Plotly says it will be removed from the core Dash API in Dash 5.0 and recommends migrating to Dash AG Grid. RevoGrid for Dash is another strong migration target.
Can a Dash grid handle one million rows?
Virtualized grids can render very large logical datasets because they only draw a small visible window. However, client-side row count is only part of the problem. JSON transfer size, browser memory, callback payloads, sorting, filtering, and cell complexity must also be tested with production-like data.