
Data Grid
Build a faster JavaScript spreadsheet
Bring editing, clipboard workflows, and large datasets into your web app.
A data grid is an interactive component for displaying and editing structured data in rows and columns. Unlike a basic HTML table, it commonly adds sorting, filtering, cell selection, keyboard navigation, and virtual scrolling for large datasets.
The question is to work with the data or simply read it. This guide lets you try a grid, compare the two approaches, and choose what fits your application.
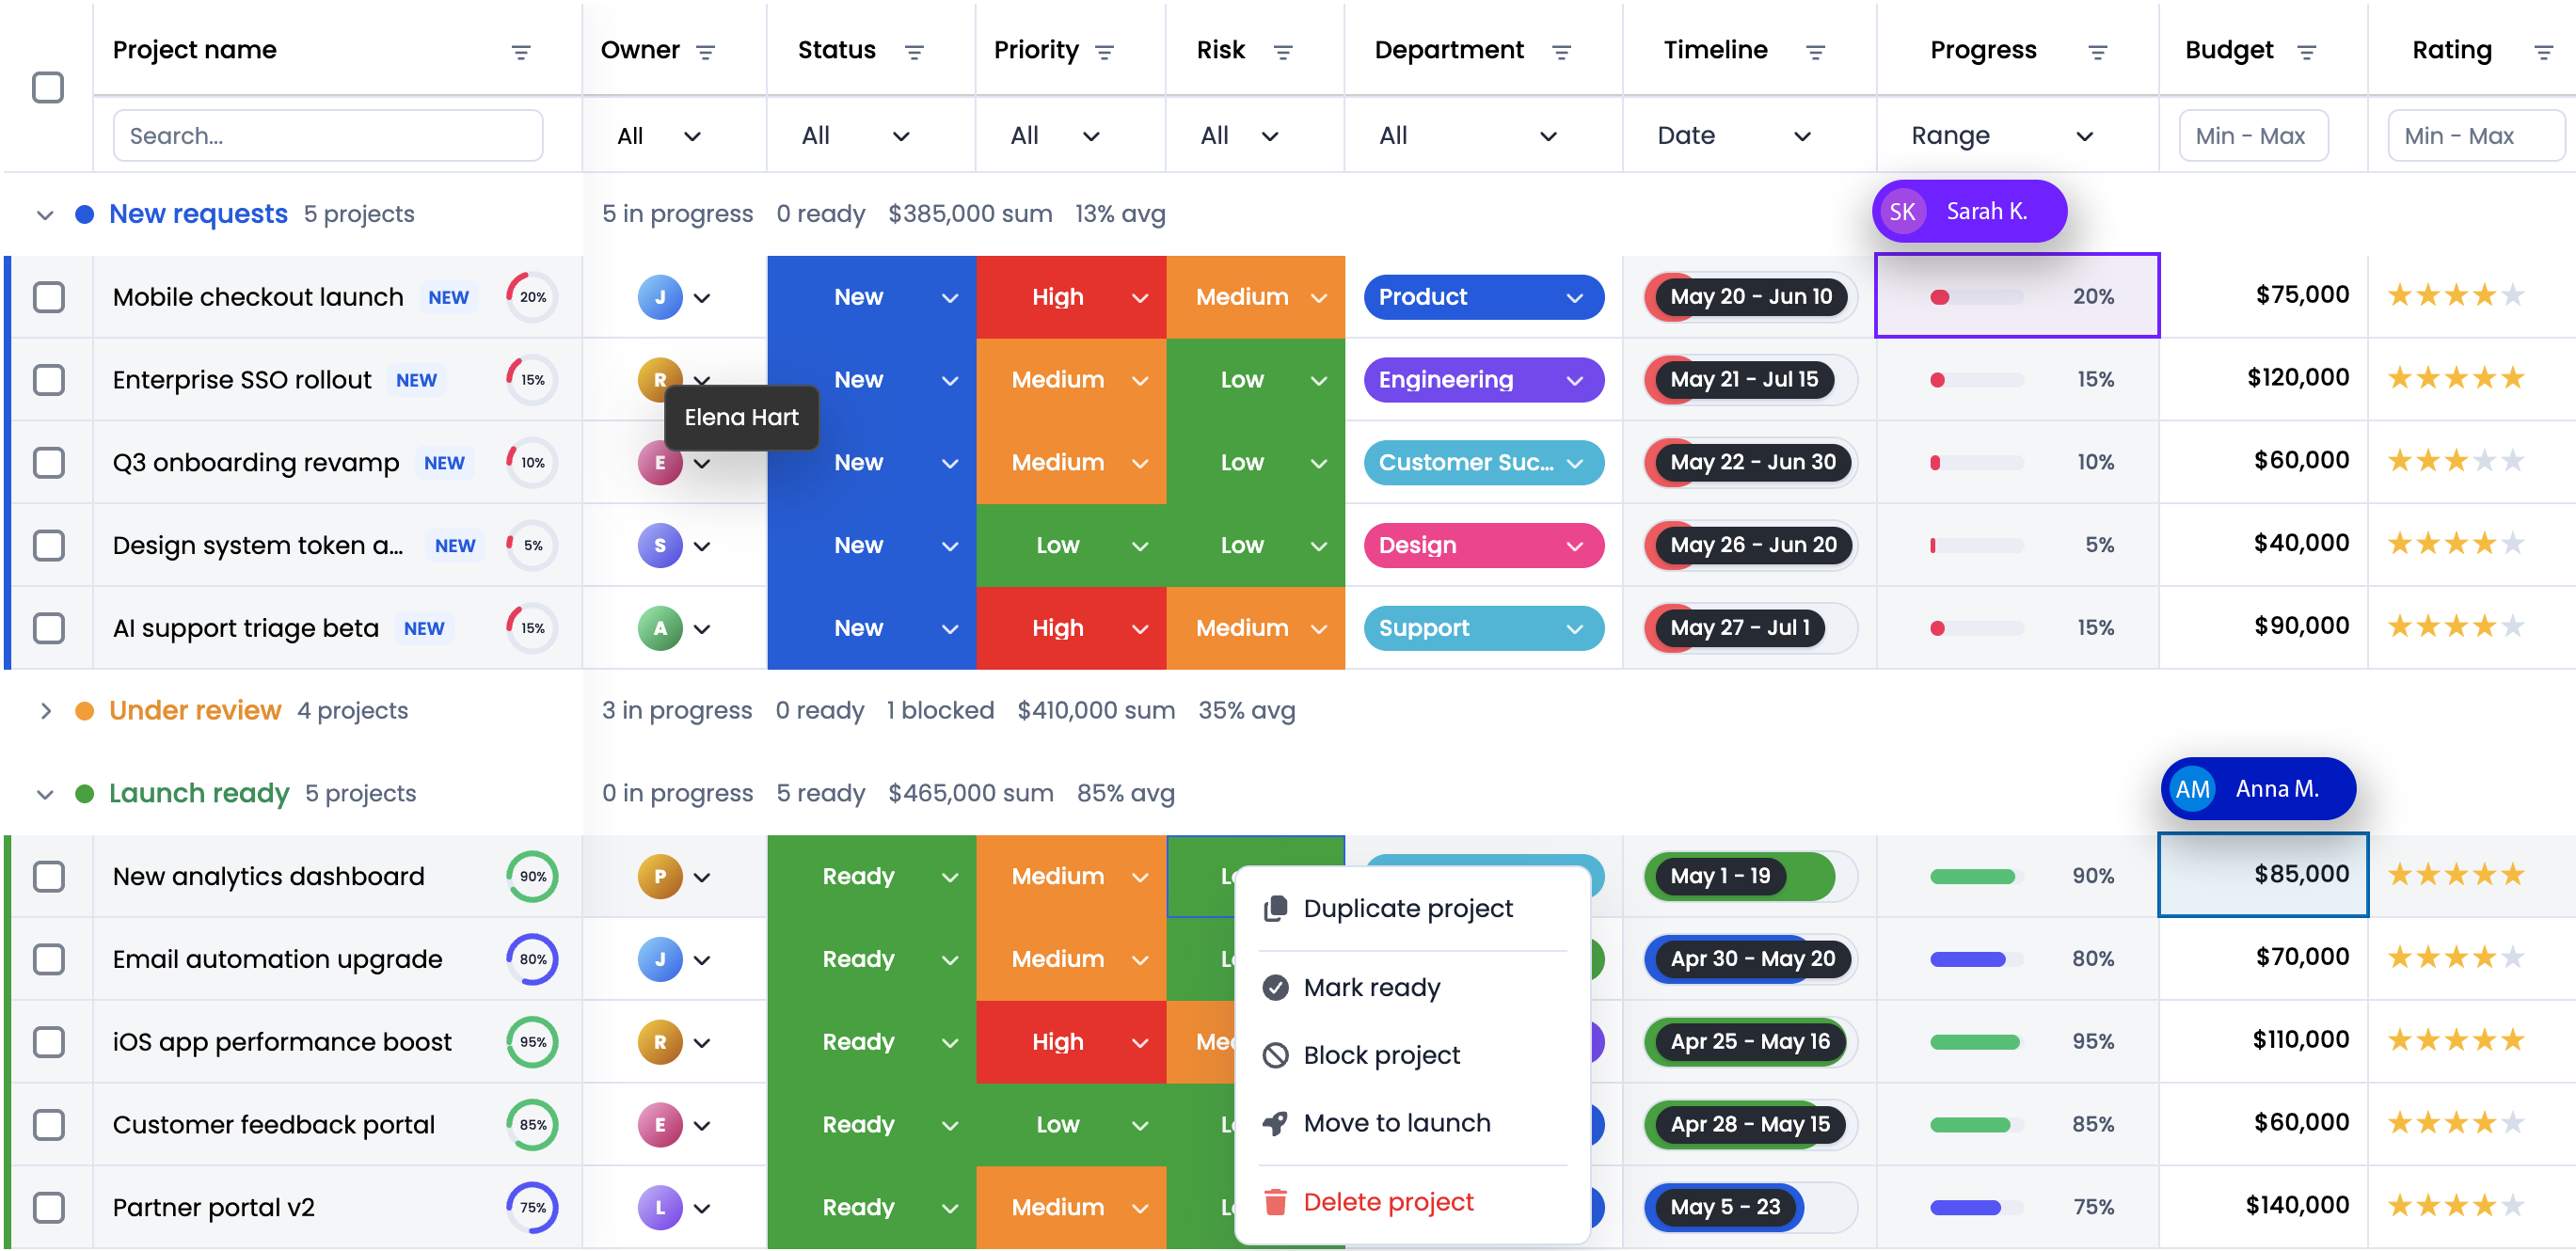
Try editing a task, clicking Due to sort it, or selecting cells with the arrow keys.
Try the live demo · Build it with JavaScript
An HTML table gives tabular content a semantic structure. A data grid adds an interaction model for tasks such as editing cells and moving through many rows. Both can be useful; the right choice depends on what people need to do.
An HTML table displays data in rows and columns:
<table>
  <tr><th>Make</th><th>Color</th><th>Price</th></tr>
  <tr><td>Mercedes</td><td>Black</td><td>$25,300</td></tr>
  <tr><td>Mazda</td><td>Green</td><td>$29,200</td></tr>
</table>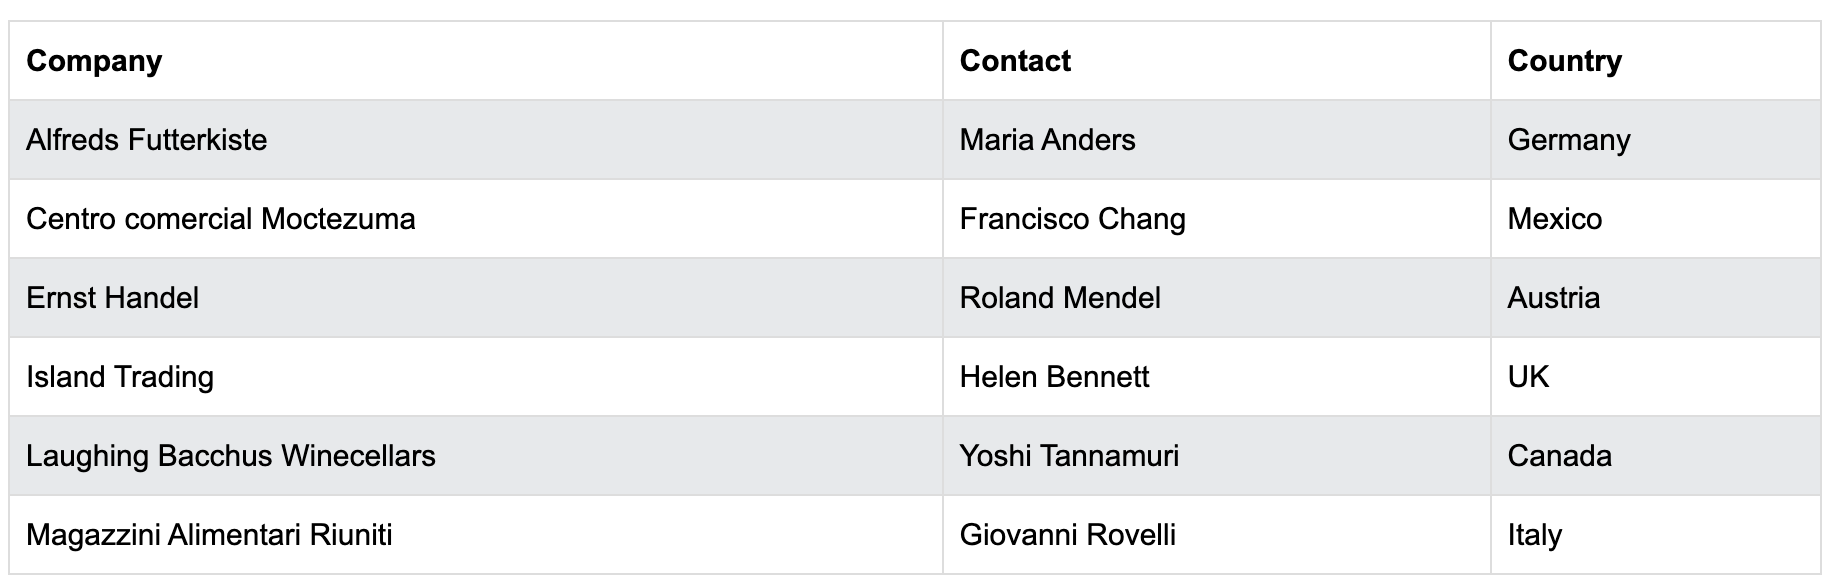
An HTML table is well suited to readable, relatively small datasets. It does not sort, filter, edit, or virtualize rows by itself; JavaScript or a table library can add those behaviors. Browser page scrolling may be all the navigation a simple report needs.
CSS Grid arranges elements on a page. It is a layout system, not a data interaction component; using CSS Grid does not automatically provide table semantics, editing, or keyboard navigation.
A data grid is useful when the tabular view becomes part of a workflow. Depending on the component and configuration, it can provide virtual scrolling, sorting, filtering, in-cell editing, selection, pinned rows or columns, and custom renderers or editors. It can be built with different markup; the distinction is what users can do, not whether the implementation uses <table> or <div>.
| Need | HTML table | Data grid |
|---|---|---|
| Read rows and columns | Native semantic markup | Structured interactive view |
| Sort or filter | Add JavaScript or a table library | Often available through configuration |
| Edit cells | Build editing and save behavior | Often provides cell editors and edit events |
| Navigate with the keyboard | Standard page and control navigation | Often supports cell focus and arrow-key navigation |
| Work with many rows | Pagination or custom virtualization | Often virtualizes visible rows |
| Select ranges or pin columns | Additional implementation | Depends on the grid's features |
The names data table and data grid are not strict standards. Some table libraries offer grid-like editing and virtualization, and some grids are mostly read-only. Check the actual behavior before choosing a component.
Start with the user task rather than the number of rows alone:
| Scenario | What users need | Reasonable starting point |
|---|---|---|
| Read-only report | Scan a modest set of values | HTML table |
| Searchable directory | Find and sort entries, without editing | HTML table plus search or a table library |
| Editable inventory | Update cells, select items, and move quickly with the keyboard | Data grid |
| Large operational dataset | Explore many rows, filter, edit, or keep columns visible | Data grid with a suitable data-loading strategy |
If sorting a short static list is the only interaction, a full grid may add complexity without helping users. When editing, selection, and navigation are central to the task, an editable data grid can supply those interactions together.
Feature availability differs between libraries and editions. RevoGrid's editing, sorting, and filtering guides show how these interactions work.
This complete browser example registers the RevoGrid Web Component, gives it a visible height, and supplies two rows. It uses the same small dataset as the interactive example above. For a package-manager setup, see the installation guide.
<!DOCTYPE html>
<html lang="en">
  <body>
    <revo-grid style="display: block; height: 240px"></revo-grid>

    <script type="module">
      import { defineCustomElement as defineRevoGrid } from 'https://cdn.jsdelivr.net/npm/@revolist/[email protected]/standalone/revo-grid.js/+esm';

      defineRevoGrid();

      const grid = document.querySelector('revo-grid');
      grid.columns = [
        { prop: 'name', name: 'Name' },
        { prop: 'role', name: 'Role' },
      ];
      grid.source = [
        { name: 'Ada Lovelace', role: 'Mathematician' },
        { name: 'Grace Hopper', role: 'Scientist' },
      ];
    </script>
  </body>
</html>Virtual scrolling keeps only the visible rows and columns in the rendered viewport, which helps avoid creating a page element for every cell. It does not make data transfer, filtering, memory use, or expensive custom cell rendering free. For large datasets, measure the whole workflow and decide whether data should be loaded in batches or processed on a server.
See the performance guide for viewport behavior and the RevoGrid benchmarks for a measured workload and methodology.
Choose an HTML table for semantic, read-only content or a modest dataset whose users mainly scan and compare values. You can add simple sorting or search without adopting a full grid. If a custom table grows to require cell editing, range selection, pinned columns, and consistent keyboard behavior, compare the maintenance cost with a data grid.
You can ask an AI coding assistant to generate a grid, and for a small, read-only table that may be enough. The first rows on screen are the easy part. An editable grid also needs reliable keyboard focus, selection, edit and cancel behavior, sorting and filtering as data changes, accessibility, and smooth scrolling through large datasets. Generated code can implement these, but your team then owns testing, fixing, and maintaining them together.
A practical middle path is to use an established data grid for those interactions and use AI to help write your columns, custom cells, and application logic. You still review and test the result. If you use an AI coding assistant with RevoGrid, the RevoGrid MCP guide shows how it can retrieve current APIs and examples instead of guessing. The interactive example above is a regular grid; it does not call an AI model.
RevoGrid provides a JavaScript data grid for interactive tabular applications. Its core covers virtual scrolling and common grid interactions; requirements such as pivoting or other advanced workflows should be evaluated separately rather than assumed from the basic example.
If you are using a framework, see the React and Vue integrations. You can also compare RevoGrid with AG Grid.
A custom HTML table is often the simplest choice for a small, read-only view. Building a grid becomes a larger project when editing, selection, keyboard behavior, virtualization, and accessibility must all work together. Compare those requirements with the behavior of an existing library before building them yourself.
Use a table when people primarily read data; use a grid when they need to work through it. Try the RevoGrid demo to test those interactions, then follow the JavaScript quick start if they fit your application.
Bring editing, clipboard workflows, and large datasets into your web app.
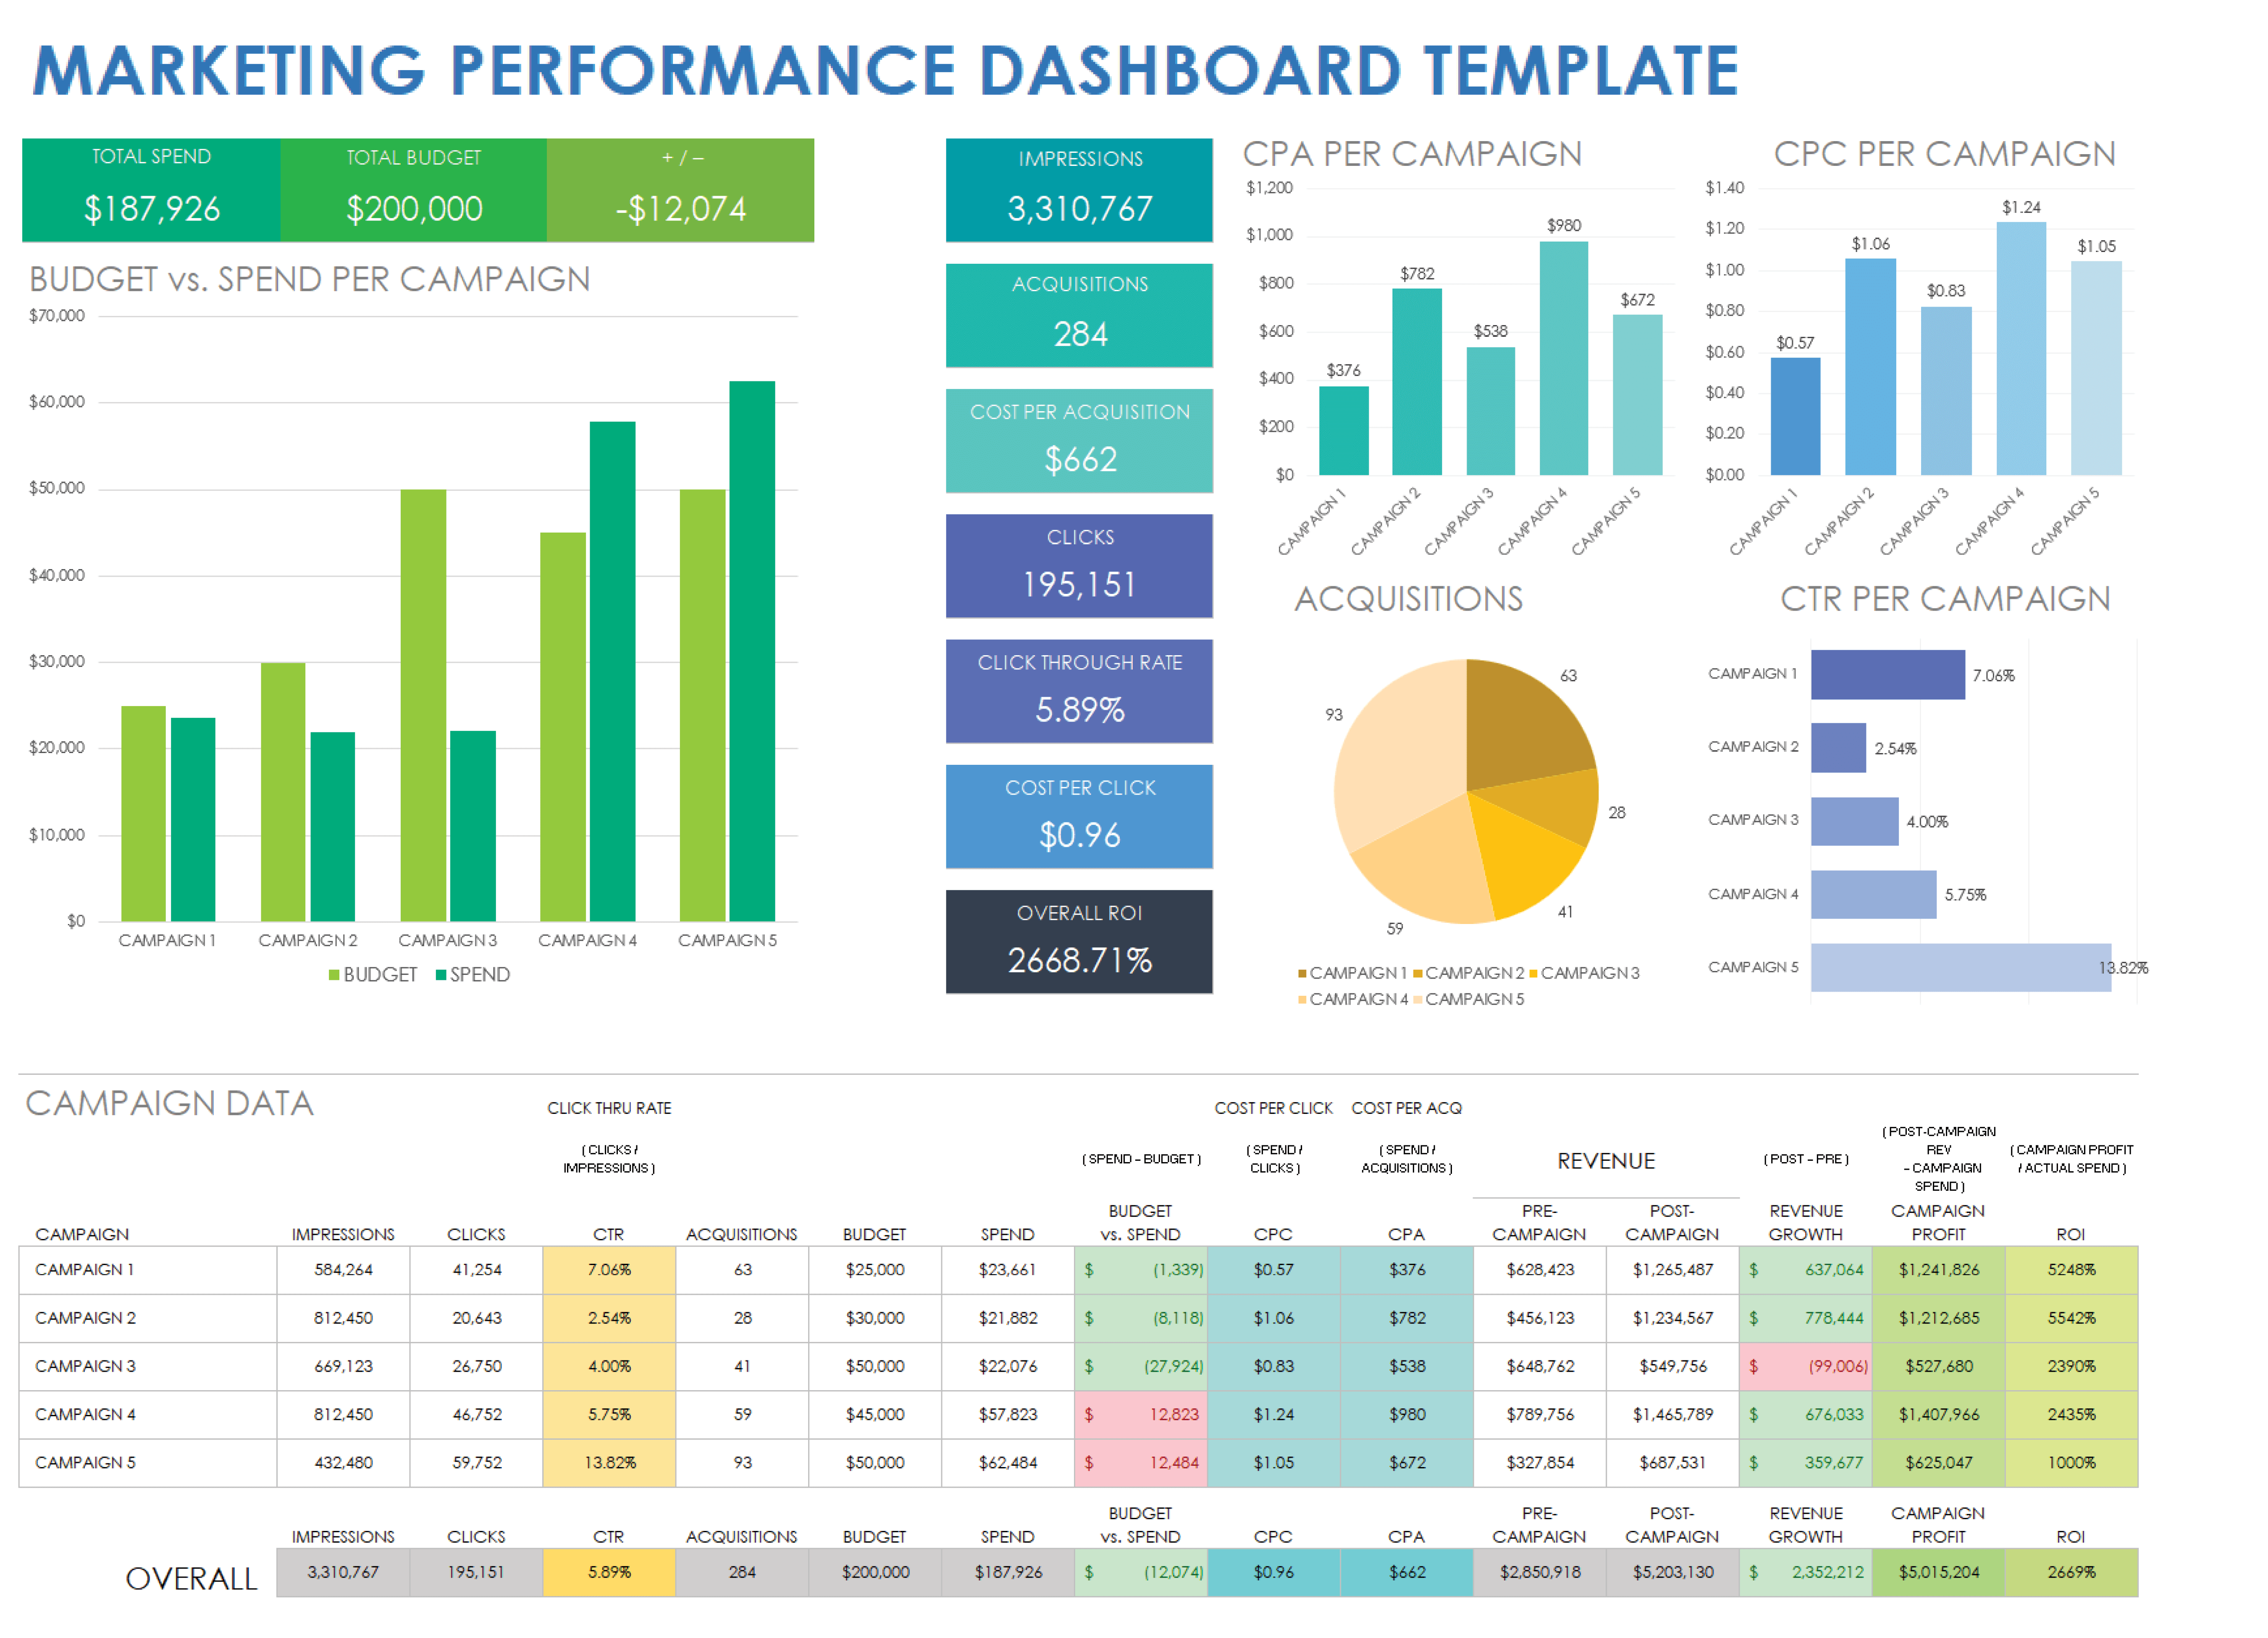
Design enterprise dashboards with JavaScript data grids using practical patterns for UX, performance, security, analytics, and operational workflows.