
Charts
Meet RevoGrid Charts: JavaScript Charts for Your Next Dashboard
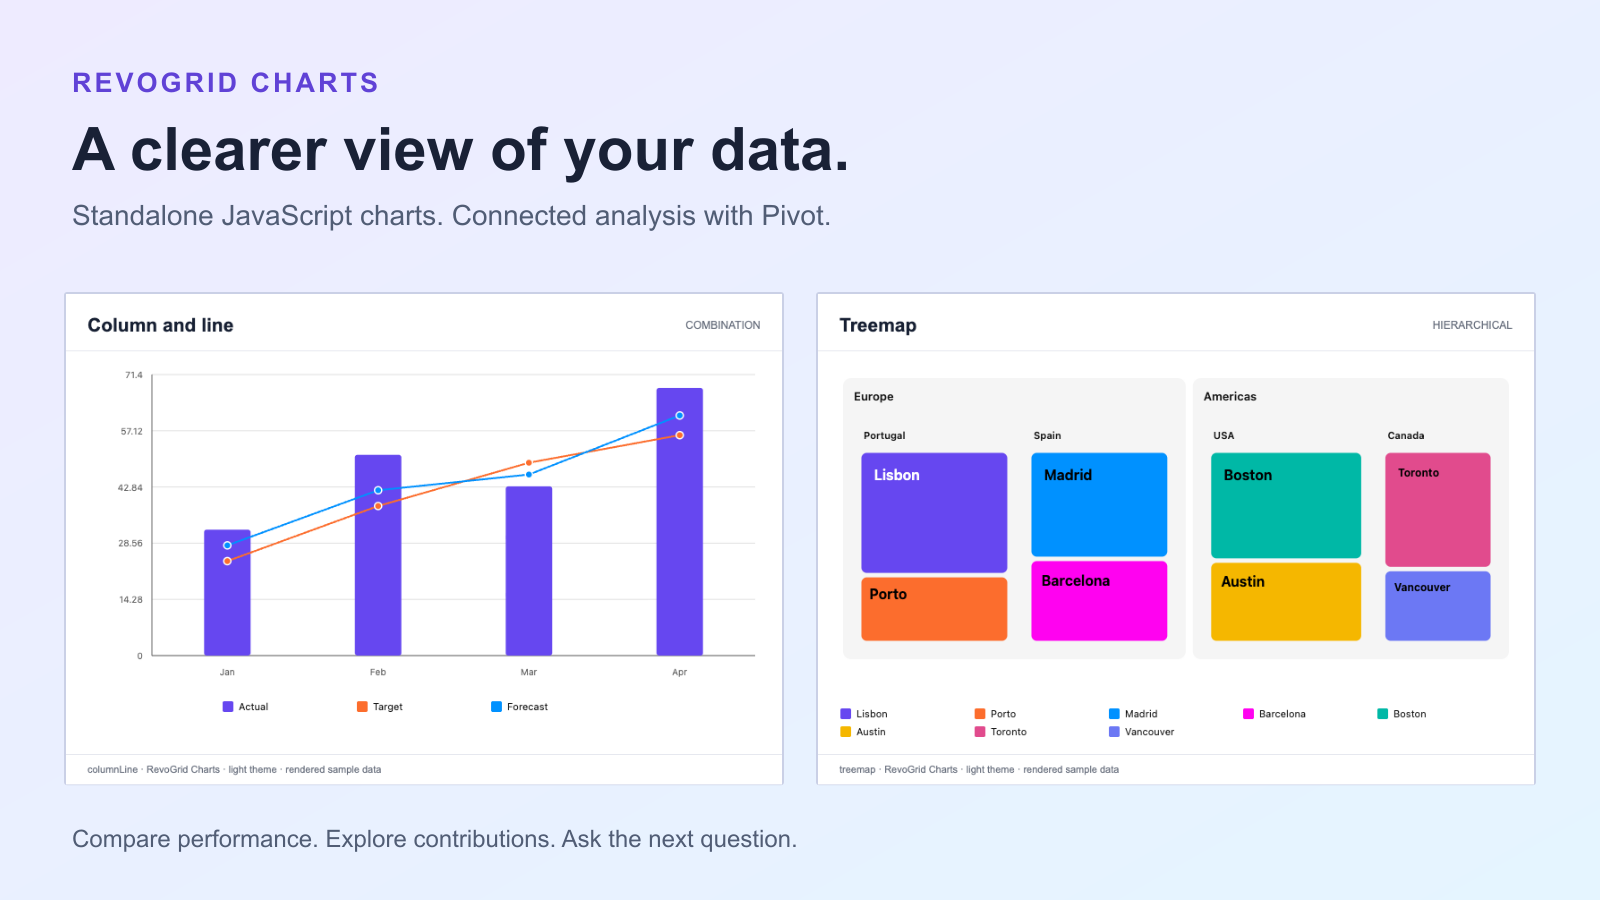
Explore RevoGrid Charts through four dashboard questions: compare categories, track targets, reveal hierarchies, and spot patterns. Start standalone, then connect to Pivot.
Europe has the most revenue. That is useful to know—but the next question is usually which products explain it, and which orders make up those numbers?
An interactive Pivot Chart keeps that investigation connected. A Pivot table groups and sums the source records; the chart presents that result visually. Users can drill into a region, inspect a product, and reach the order lines behind a bar.
Source-verified preview
The recordings and code use the current Pivot Charts source build. Confirm your installed release supports underlyingRecords and chart CSV export before using those steps.
Our example contains 18 fictional order lines for chairs, desks, and lamps sold across three regions in January and February. Revenue is in USD. Each source row represents one order line; there are no subtotal rows mixed into the input.
| Region | January | February | Total |
|---|---|---|---|
| Europe | $31,000 | $41,000 | $72,000 |
| Americas | $27,000 | $33,000 | $60,000 |
| APAC | $19,000 | $23,000 | $42,000 |
| All regions | $77,000 | $97,000 | $174,000 |
A grouped column chart compares the two months within each region. The table retains the exact amounts. We will follow three questions:
The animations follow the same running example through four states: all regions, Europe's products, one order's source records, and a February-only report. The complete example source below supplies the data and mounting code. For a larger live example, open the Pivot Charts dashboard, which uses a separate retail dataset.
The buttons, breadcrumb text, and page layout are a small application shell. Aggregation, chart rendering, hierarchy drilling, linked refresh, the underlying-record dialog, and chart CSV export come from RevoGrid Pivot and Charts.
For a JavaScript application with licensed or trial access configured, install the grid, Pro foundation, and Pivot package:
pnpm add @revolist/revogrid @revolist/revogrid-pro @revolist/pivotPivot and Pivot Charts are commercial features. Follow the installation guide for trial access, and use mutually compatible package versions.
The useful part of the configuration is its analytical structure:
const pivotConfig = {
  dimensions: [
    { prop: 'region', name: 'Region' },
    { prop: 'product', name: 'Product' },
    { prop: 'month', name: 'Month' },
    { prop: 'revenue', name: 'Revenue (USD)' },
  ],
  rows: ['region', 'product'],
  columns: ['month'],
  values: [{ id: 'revenue', prop: 'revenue', aggregator: 'sum' }],
  collapsed: true,
  groupAggregations: true,
  totals: { grandTotal: true },
}
Region → Product defines the row hierarchy. Month creates the column groups, and SUM aggregates the order-line revenue. The table starts with collapsed regional groups; groupAggregations: true displays their aggregate values. The chart initially shows the immediate region members; its hierarchy allows drilling into their products.
In this compact dataset, Jan and Feb are category labels, not parsed dates. A report spanning multiple years should use an unambiguous year/month representation or configured date dimensions.
Register the grid element, configure its plugins, and attach it to an existing container. Import the commercial styles once:
import { defineCustomElements } from '@revolist/revogrid/loader'
import { PivotPlugin, PivotChartsPlugin, createPivotChartsRenderer } from '@revolist/pivot'
import '@revolist/revogrid-pro/dist/revogrid-pro.css'
import '@revolist/pivot/styles.css'

defineCustomElements()
await customElements.whenDefined('revo-grid')

const grid = document.createElement('revo-grid')
grid.style.height = '225px'
grid.theme = 'compact'
grid.hideAttribution = true
grid.source = sales
grid.pivot = pivotConfig
grid.pivotCharts = { renderer: createPivotChartsRenderer() }
grid.plugins = [PivotPlugin, PivotChartsPlugin]
document.querySelector('#report').append(grid)
Create the chart after the first Pivot model commits. The complete example below handles both the pivot-model-changed event and the case where that model is already ready. Once ready, the chart creation is:
const plugins = await grid.getPlugins()
const charts = plugins.find(plugin => plugin instanceof PivotChartsPlugin)

const chart = await charts.createChart({
  container: document.querySelector('#revenue-chart'),
  chartType: 'groupedColumn',
  linked: true,
  totals: 'none',
  drillSyncMode: 'chart',
  underlyingRecords: true,
  interaction: { mode: 'drill' },
  presentation: {
    title: 'Revenue by region',
    yAxisTitle: 'Revenue (USD)',
    legendPosition: 'bottom',
    dataLabels: true,
  },
})
The chart uses an application-owned container with an explicit height. linked: true keeps it connected to the active Pivot. totals: 'none' prevents a grand-total bar from appearing alongside its own contributing regions.
drillSyncMode: 'chart' keeps chart drilling local: exploring Europe changes the chart's hierarchy scope while the Pivot table retains its layout. This is separate from being linked to report data and filters.
Clicking a regional bar reveals the next level of the row hierarchy. The Europe scope contains chairs, desks, and lamps, split into the same two months.
Chairs account for half of Europe's revenue. February contributes $20,000 of those chair sales. That is a much more useful explanation than simply naming the largest region.
The Explore Europe shortcut uses the same public drill API. It finds the real category by its semantic path rather than assuming a bar's screen position:
await chart.resetDrill()
const dataset = await charts.getChartData({
  chartType: 'groupedColumn',
  scope: { rowPath: [] },
})
const europe = dataset.categories.find(
  category => category.path.length === 1 && category.path[0] === 'Europe',
)
if (europe && chart.canDrillDown(europe)) {
  await chart.drillDown(europe)
}
Use chart.drillUp() to move to the parent, or chart.resetDrill() to return to the root. Drilling requires a real next hierarchy level; a product at the leaf cannot reveal an invented deeper group.
Drill-down moves between aggregate hierarchy levels. Underlying records shows the source rows contributing to one observation. They answer different questions.
Click or keyboard-focus Europe's February Chairs bar, then choose View underlying records. Hovering opens its tooltip; it does not enable the records action. The native dialog shows order SO-102, whose $20,000 revenue matches that bar.
Here, underlyingRecords: true reuses Pivot's paginated drillthrough API. Built-in access requires a current linked chart without an independent chart query. For snapshots or independently queried charts, supply an explicit records provider. In server-backed applications, the server must supply authorized records; the chart cannot reconstruct them from totals.
The example's February only checkbox updates the Pivot member selection:
grid.pivot = {
  ...pivotConfig,
  filterSelections: { month: ['Feb'] },
}
Both the report and its linked chart refresh. At the regional level, the remaining values are Europe $41,000, Americas $33,000, and APAC $23,000. The checkbox and its handler belong to our application; the Pivot filter and linked chart update belong to the product.
For a fixed comparison, create a chart with linked: false. It captures the initial projected dataset and ignores subsequent Pivot changes. That snapshot is useful for comparison, but should not be presented as a live view of the current report.
Export the chart's current view through the chart plugin:
await charts.downloadChart(chart.id, {
  fileFormat: 'csv',
  fileName: 'sales-chart.csv',
})

// During application teardown:
chart.destroy()
grid.remove()
Chart CSV contains chart data, not a dump of every source order. At a drilled level, that distinction matters. Use the underlying-record workflow when you need the contributing orders.
The captured example uses the following dataset and mounting module. The module is TypeScript for checked public API types; the DOM integration also applies to plain JavaScript. Mount it into a connected container with await mountSalesExample(host), and call the returned destroy() method when leaving the page. The capture component below supplies the buttons and container lifecycle.
/** Fictional order lines, in USD. One row is one order line, never a subtotal. */
export const sales = [
  { order: 'SO-101', region: 'Europe', product: 'Chairs', month: 'Jan', revenue: 16000 },
  { order: 'SO-102', region: 'Europe', product: 'Chairs', month: 'Feb', revenue: 20000 },
  { order: 'SO-103', region: 'Europe', product: 'Desks', month: 'Jan', revenue: 10000 },
  { order: 'SO-104', region: 'Europe', product: 'Desks', month: 'Feb', revenue: 14000 },
  { order: 'SO-105', region: 'Europe', product: 'Lamps', month: 'Jan', revenue: 5000 },
  { order: 'SO-106', region: 'Europe', product: 'Lamps', month: 'Feb', revenue: 7000 },
  { order: 'SO-107', region: 'Americas', product: 'Chairs', month: 'Jan', revenue: 11000 },
  { order: 'SO-108', region: 'Americas', product: 'Chairs', month: 'Feb', revenue: 13000 },
  { order: 'SO-109', region: 'Americas', product: 'Desks', month: 'Jan', revenue: 14000 },
  { order: 'SO-110', region: 'Americas', product: 'Desks', month: 'Feb', revenue: 16000 },
  { order: 'SO-111', region: 'Americas', product: 'Lamps', month: 'Jan', revenue: 2000 },
  { order: 'SO-112', region: 'Americas', product: 'Lamps', month: 'Feb', revenue: 4000 },
  { order: 'SO-113', region: 'APAC', product: 'Chairs', month: 'Jan', revenue: 8000 },
  { order: 'SO-114', region: 'APAC', product: 'Chairs', month: 'Feb', revenue: 10000 },
  { order: 'SO-115', region: 'APAC', product: 'Desks', month: 'Jan', revenue: 7000 },
  { order: 'SO-116', region: 'APAC', product: 'Desks', month: 'Feb', revenue: 8000 },
  { order: 'SO-117', region: 'APAC', product: 'Lamps', month: 'Jan', revenue: 4000 },
  { order: 'SO-118', region: 'APAC', product: 'Lamps', month: 'Feb', revenue: 5000 },
]import { defineCustomElements } from '@revolist/revogrid/loader'
import {
PivotPlugin,
PivotChartsPlugin,
createPivotChartsRenderer,
type PivotChartRef,
type PivotConfig,
} from '@revolist/pivot'
import '@revolist/revogrid-pro/dist/revogrid-pro.css'
import '@revolist/pivot/styles.css'
import { sales } from './sales'
import { salesChartCsv } from './csv'
export const pivotConfig: PivotConfig = {
dimensions: [
{ prop: 'region', name: 'Region' },
{ prop: 'product', name: 'Product' },
{ prop: 'month', name: 'Month' },
{ prop: 'revenue', name: 'Revenue (USD)' },
],
rows: ['region', 'product'],
columns: ['month'],
values: [{ id: 'revenue', prop: 'revenue', aggregator: 'sum' }],
collapsed: true,
groupAggregations: true,
totals: { grandTotal: true },
}
/** Plain JavaScript DOM integration; Vue only supplies the article's mounting container. */
export async function mountSalesExample(host: HTMLElement) {
defineCustomElements()
await customElements.whenDefined('revo-grid')
const grid = document.createElement('revo-grid')
grid.style.height = '225px'
grid.theme = 'compact'
grid.hideAttribution = true
grid.readonly = true
grid.resize = true
grid.colSize = 240
grid.setAttribute('aria-label', 'Sales Pivot table')
grid.source = sales.map(row => ({ ...row }))
grid.pivot = pivotConfig
grid.pivotCharts = {
renderer: createPivotChartsRenderer({
palette: ['#4f46e5', '#0f9d8a'],
labels: { styles: { data: { fontWeight: 600 } } },
}),
}
grid.plugins = [PivotPlugin, PivotChartsPlugin]
const chartHost = document.createElement('div')
chartHost.className = 'article-pivot-chart'
const table = document.createElement('div')
table.className = 'article-pivot-table'
table.append(grid)
host.append(chartHost, table)
let disposed = false
let chart: PivotChartRef | undefined
let charts: PivotChartsPlugin | undefined
let opening: Promise<void> | undefined
const changed = () => {
host.dispatchEvent(
new CustomEvent('sales-chart-change', {
detail: { path: chart?.getDrillState().active.row.path ?? [] },
}),
)
}
const start = () => {
if (disposed || chart || opening) return
opening = (async () => {
const plugins = await grid.getPlugins()
charts = plugins.find(plugin => plugin instanceof PivotChartsPlugin) as
PivotChartsPlugin | undefined
if (!charts || disposed) return
chart = await charts.createChart({
container: chartHost,
chartType: 'groupedColumn',
linked: true,
totals: 'none',
drillSyncMode: 'chart',
underlyingRecords: true,
interaction: { mode: 'drill' },
presentation: {
title: 'Monthly revenue',
subtitle: 'January and February · USD',
yAxisTitle: 'Revenue (USD)',
legendPosition: 'bottom',
dataLabels: true,
},
})
if (disposed) chart.destroy()
else {
host.dataset.ready = 'true'
changed()
}
})()
.catch(error => {
host.dispatchEvent(new CustomEvent('sales-chart-error', { detail: String(error) }))
})
.finally(() => {
opening = undefined
})
}
const drilled = () => {
if (!disposed) changed()
}
grid.addEventListener('pivot-model-changed', start)
grid.addEventListener('pivot-chart-drilled', drilled)
// The first model can commit before getPlugins resolves; also check the current snapshot.
const plugins = await grid.getPlugins()
const pivot = plugins.find(plugin => plugin instanceof PivotPlugin) as PivotPlugin | undefined
if (pivot?.getRuntimeSnapshot()?.revision) start()
return {
async exploreEurope() {
if (!chart || !charts) return
await chart.resetDrill()
const dataset = await charts.getChartData({
chartType: 'groupedColumn',
scope: { rowPath: [] },
})
const europe = dataset.categories.find(
category => category.path.length === 1 && category.path[0] === 'Europe',
)
if (europe && chart.canDrillDown(europe)) await chart.drillDown(europe)
},
async reset() {
await chart?.resetDrill()
await drilled()
},
async showFebruary(only: boolean) {
if (!chart) return
grid.pivot = { ...pivotConfig, filterSelections: only ? { month: ['Feb'] } : {} }
await chart.update({
presentation: { subtitle: only ? 'February · USD' : 'January and February · USD' },
})
await chart.resetDrill()
},
async exportCsv() {
if (!chart || !charts) return
const csv = await salesChartCsv(charts, chart)
if (disposed) return
const url = URL.createObjectURL(new Blob([csv], { type: 'text/csv;charset=utf-8' }))
const anchor = document.createElement('a')
anchor.href = url
anchor.download = 'sales-chart.csv'
document.body.append(anchor)
try {
anchor.click()
} finally {
anchor.remove()
// Leave the browser time to consume the download before releasing its URL.
window.setTimeout(() => URL.revokeObjectURL(url), 1000)
}
},
destroy() {
disposed = true
grid.removeEventListener('pivot-model-changed', start)
grid.removeEventListener('pivot-chart-drilled', drilled)
chart?.destroy()
host.replaceChildren()
},
}
}<script setup lang="ts">
import { onBeforeUnmount, onMounted, ref } from 'vue'
const host = ref<HTMLElement>()
const ready = ref(false)
const busy = ref(false)
const error = ref('')
const path = ref<string[]>([])
const february = ref(false)
let example: Awaited<ReturnType<typeof import('./mount').mountSalesExample>> | undefined
let disposed = false
async function act(action: () => Promise<unknown> | undefined) {
busy.value = true
error.value = ''
try {
await action()
} catch (cause) {
error.value = String(cause)
} finally {
busy.value = false
}
}
onMounted(async () => {
try {
const { mountSalesExample } = await import('./mount')
if (disposed || !host.value) return
host.value.addEventListener('sales-chart-change', event => {
ready.value = true
path.value = (event as CustomEvent).detail.path.map(String)
})
host.value.addEventListener('sales-chart-error', event => {
error.value = (event as CustomEvent).detail
})
example = await mountSalesExample(host.value)
if (disposed) example.destroy()
} catch (cause) {
error.value = String(cause)
}
})
onBeforeUnmount(() => {
disposed = true
example?.destroy()
})
</script>
<template>
<section class="sales-example" aria-label="Interactive sales Pivot Charts example">
<header class="sales-example-header">
<div>
<span class="sales-eyebrow">FROM SUMMARY TO SOURCE</span>
<h3>Where does the revenue come from?</h3>
</div>
<span class="sales-data-label">18 fictional order lines · USD</span>
</header>
<div class="sales-actions">
<button :disabled="!ready || busy" @click="act(() => example?.reset())">All regions</button>
<button
:disabled="!ready || busy || path[0] === 'Europe'"
@click="act(() => example?.exploreEurope())"
>
Explore Europe →
</button>
<label
><input
v-model="february"
type="checkbox"
:disabled="!ready || busy"
@change="act(() => example?.showFebruary(february))"
/>
February only</label
>
<button :disabled="!ready || busy" @click="act(() => example?.exportCsv())">
Export chart CSV
</button>
</div>
<p class="sales-breadcrumb" aria-live="polite">
{{
ready
? `All regions${path.length ? ' / ' + path.join(' / ') : ''}`
: 'Loading Pivot Charts…'
}}
</p>
<p v-if="error" role="alert">{{ error }}</p>
<div ref="host" class="sales-render-host" :aria-busy="busy" />
<p class="sales-hint">
Click a region bar to drill into products. The period filter updates the linked report; chart
drilling leaves the table layout unchanged. CSV exports chart data at the current drill level.
</p>
</section>
</template>
<style>
.sales-example {
box-sizing: border-box;
width: 100%;
min-width: 0;
margin: 24px 0 36px;
padding: 24px;
border: 1px solid var(--vp-c-divider);
border-radius: 16px;
background: var(--vp-c-bg);
box-shadow: 0 10px 32px #162b4610;
}
.sales-example-header {
display: flex;
align-items: center;
justify-content: space-between;
gap: 16px;
}
.sales-example-header h3 {
margin: 6px 0 0;
font-size: 21px;
line-height: 1.3;
}
.sales-eyebrow {
color: #635bd6;
font-size: 11px;
font-weight: 750;
letter-spacing: 0.12em;
}
.sales-data-label,
.sales-hint {
color: var(--vp-c-text-2);
font-size: 12px;
line-height: 1.7;
}
.sales-actions {
display: flex;
align-items: center;
flex-wrap: wrap;
gap: 10px;
margin: 20px 0 0;
}
.sales-actions button {
border: 1px solid var(--vp-c-divider);
border-radius: 7px;
padding: 7px 12px;
font-size: 12px;
background: var(--vp-c-bg-soft);
cursor: pointer;
}
.sales-actions button:disabled {
opacity: 0.5;
cursor: default;
}
.sales-actions button:focus-visible {
outline: 2px solid var(--vp-c-brand-1);
outline-offset: 3px;
}
.sales-actions label {
display: flex;
align-items: center;
gap: 6px;
font-size: 12px;
}
.sales-breadcrumb {
color: var(--vp-c-text-2);
font-size: 12px;
margin: 12px 0 4px !important;
}
.sales-render-host {
min-width: 0;
}
.article-pivot-chart {
height: 355px;
position: relative;
}
.article-pivot-table {
margin-top: 18px;
border: 1px solid var(--vp-c-divider);
border-radius: 8px;
overflow: hidden;
/* Compact grid text uses a light theme; give its transparent cells a surface. */
background: #fff;
color: #1b2942;
color-scheme: light;
}
.article-pivot-table revo-grid {
width: 100%;
font-size: 12px;
}
.sales-hint {
margin: 14px 0 0 !important;
}
.sales-example [data-chart-underlying-records],
.sales-example [data-chart-underlying-records-dialog] button {
border: 1px solid var(--vp-c-divider);
border-radius: 6px;
padding: 6px 10px;
margin: 4px 8px 4px 0;
font-size: 12px;
background: var(--vp-c-bg-soft);
cursor: pointer;
}
.sales-example [data-chart-underlying-records]:disabled,
.sales-example [data-chart-underlying-records-dialog] button:disabled {
opacity: 0.5;
cursor: default;
}
.sales-example [data-chart-underlying-records-dialog] h2 {
border: 0;
padding: 0;
font-size: 16px;
font-weight: 600;
}
.sales-example [data-chart-underlying-records-dialog] table {
width: 100%;
border-collapse: collapse;
font-size: 13px;
}
.sales-example [data-chart-underlying-records-dialog] th,
.sales-example [data-chart-underlying-records-dialog] td {
padding: 10px 14px;
border-bottom: 1px solid var(--vp-c-divider);
text-align: left;
}
@media (max-width: 600px) {
.sales-example {
padding: 14px;
}
.sales-example-header {
align-items: flex-start;
flex-direction: column;
gap: 8px;
}
.sales-example-header h3 {
font-size: 18px;
}
.article-pivot-chart {
height: 370px;
}
}
</style>For a broader report, try the Pivot Charts dashboard. Read what a Pivot table does, explore standalone JavaScript Charts, or follow the React Pivot tutorial for a larger application.
Explore RevoGrid Charts through four dashboard questions: compare categories, track targets, reveal hierarchies, and spot patterns. Start standalone, then connect to Pivot.
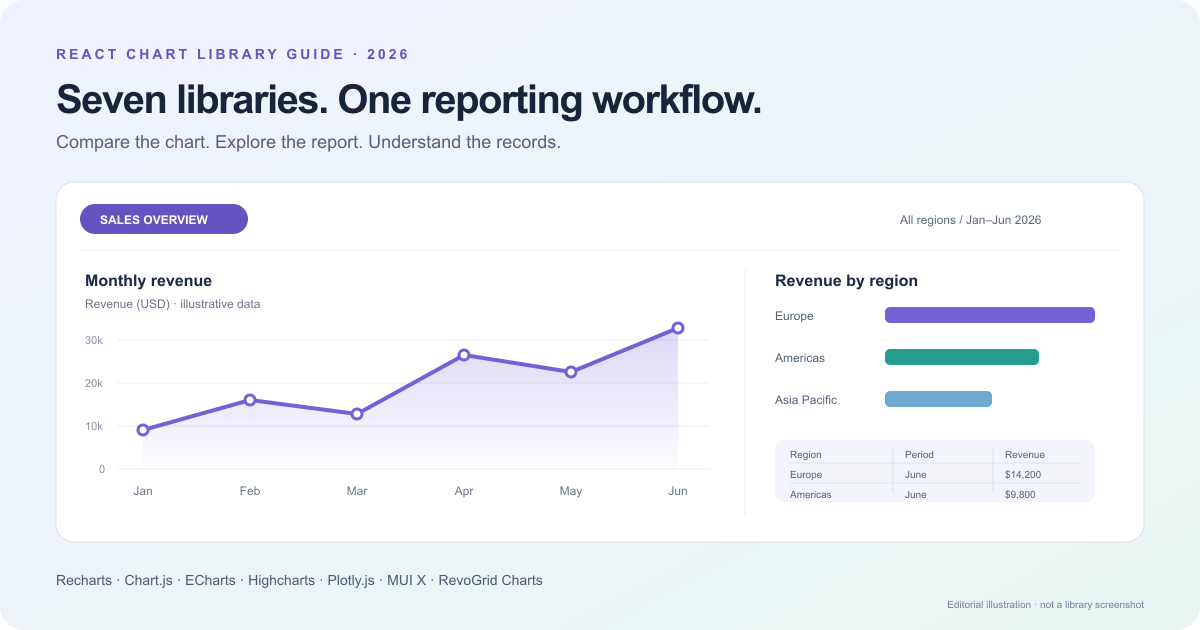
Compare 7 React chart libraries for BI dashboards: Recharts, Chart.js, ECharts, Highcharts, Plotly.js, MUI X, and RevoGrid. See features and trade-offs.