Yes, for data shapes and devices that fit a client-side model. Run the included browser benchmark and use the server engine when measured latency or memory misses your target.
How to Build a React Pivot Table for Large Datasets
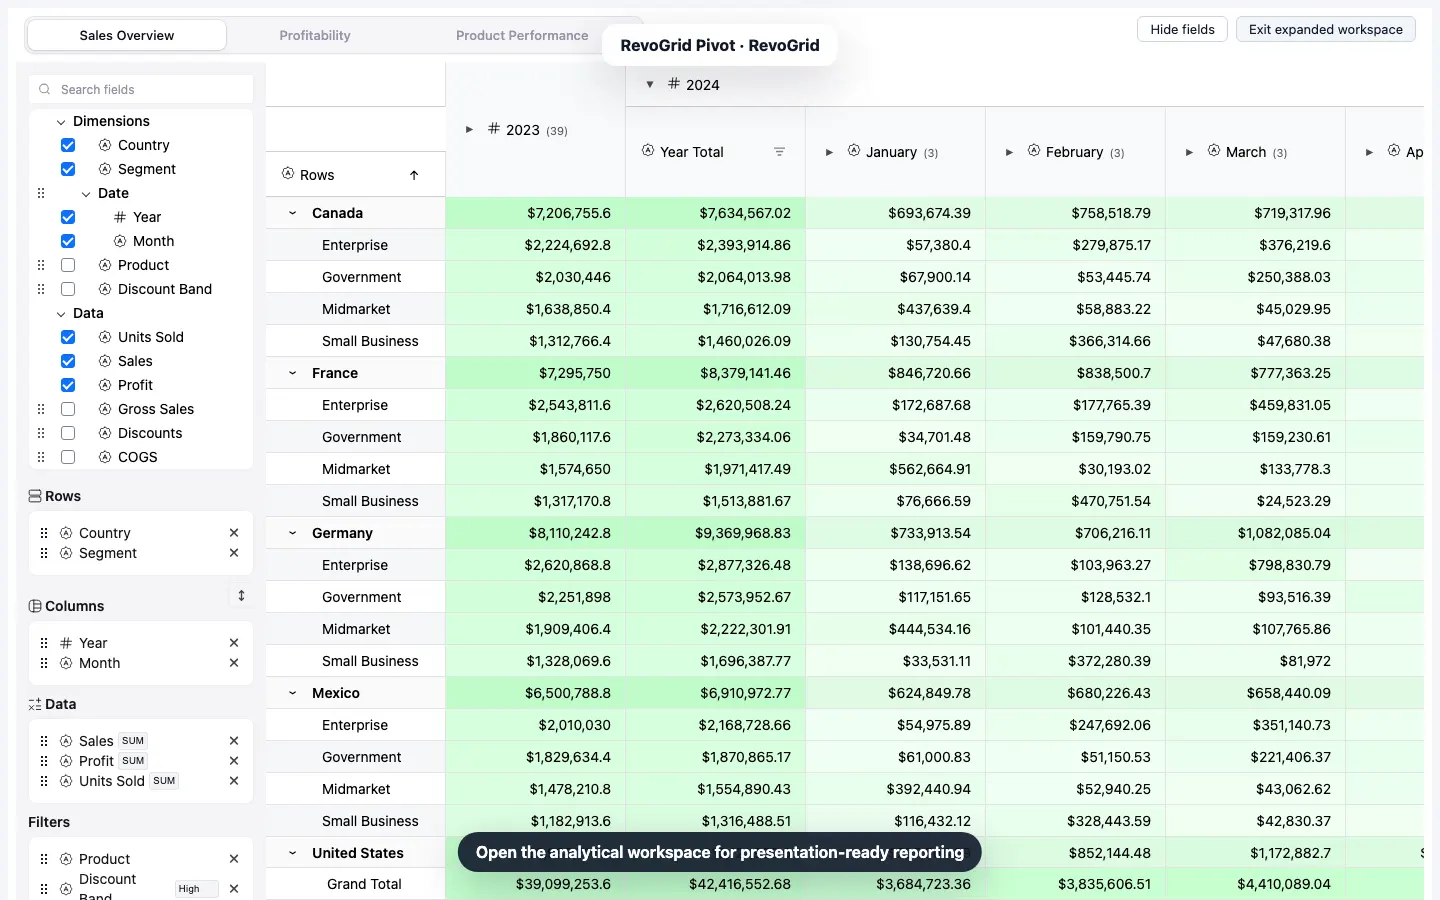
This tutorial builds one complete sales analytics application. It does not stop at rendering a grid. The finished React Pivot Table lets a user rearrange fields, calculate standard and custom metrics, inspect subtotals and grand totals, keep a chart synchronized with the current Pivot result, export a report that opens in Excel, restore a saved layout, and run the same workflow with 10,000, 100,000, or 350,000 source rows.
Use these companion resources while you build:
- Live RevoGrid Pivot demo
- Complete Pivot repository, including the React implementation
- React Pivot Table Component for product capabilities, licensing, and evaluation
- RevoGrid Pivot documentation
RevoGrid Pivot is part of RevoGrid Pro Advanced. The open-source grid supplies the high-performance rendering foundation; the commercial Pivot package supplies the analytical model, field configuration, totals, charts, state helpers, and remote-engine contracts.
What we are building
The application answers a concrete question: How do revenue, profit, and order volume change by region, sales channel, year, and quarter?
It has four layers:
| Layer | Responsibility |
|---|---|
| React | Own source rows, saved configuration, benchmark controls, buttons, and component lifecycle. |
| RevoGrid | Render the generated result through a virtualized grid viewport. |
| Pivot plugin | Filter, group, aggregate, total, and project raw records into Pivot rows and columns. |
| Pivot Charts | Project the committed Pivot model into a linked chart that refreshes after data or configuration changes. |
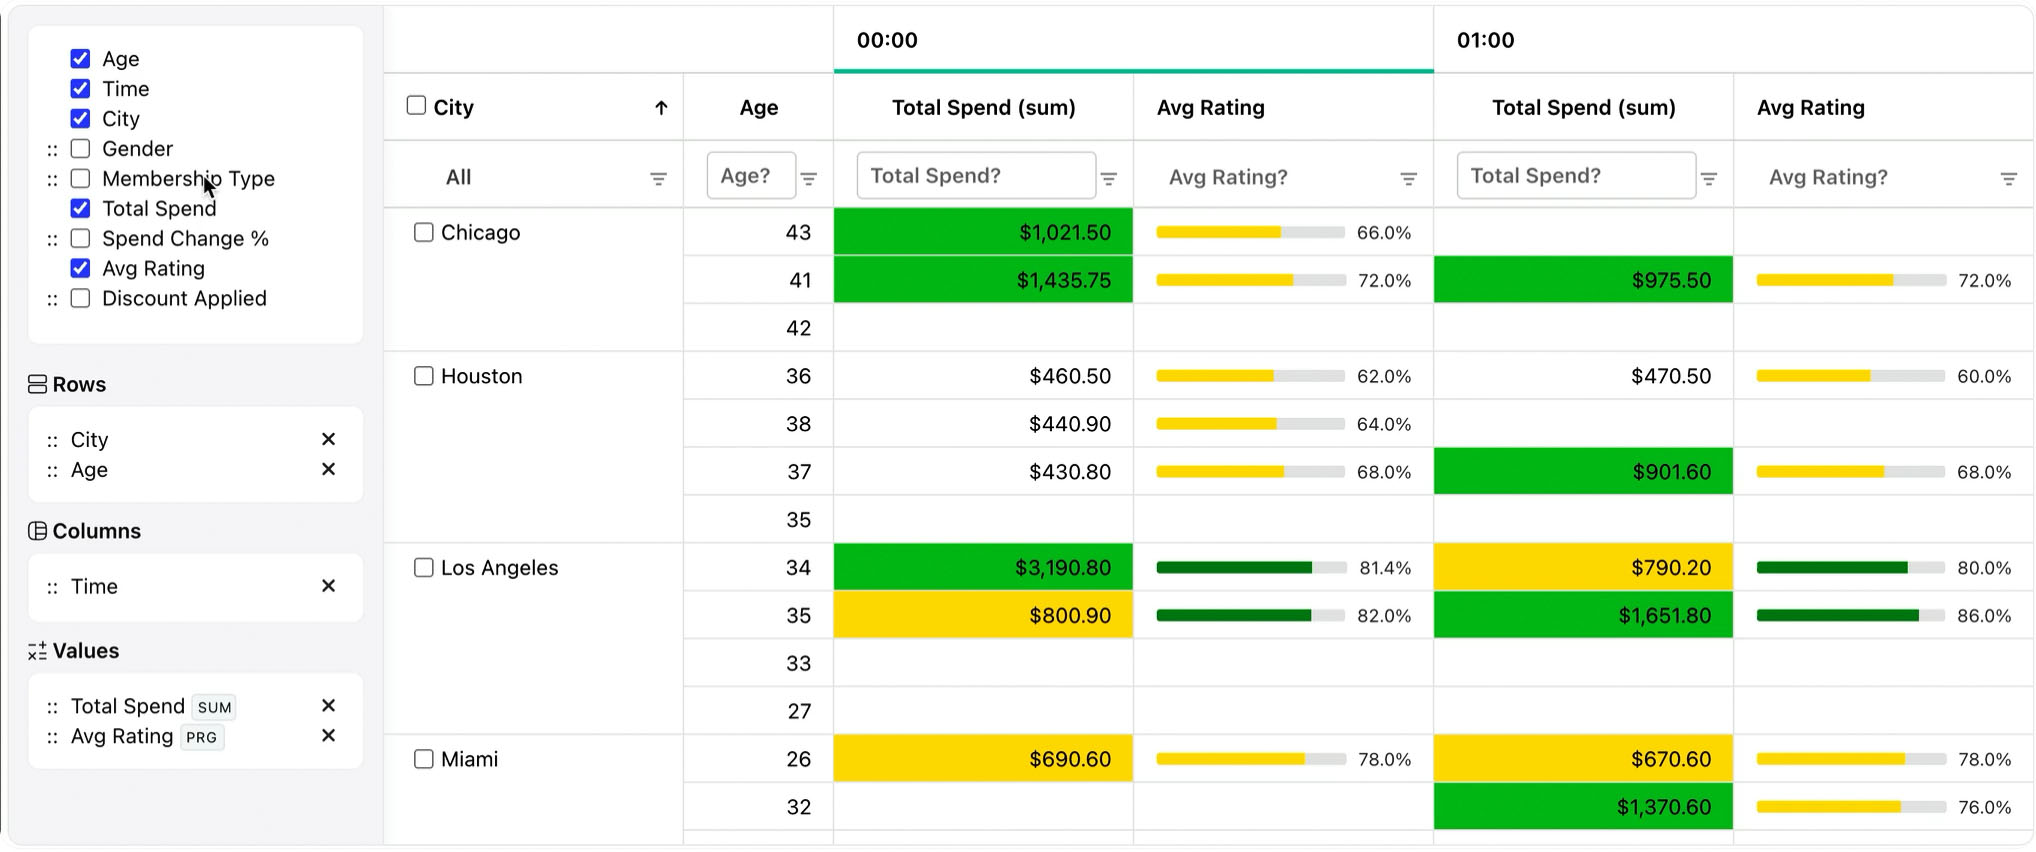
The field model intentionally follows Excel. Microsoft's PivotTable documentation describes the same Rows, Columns, Values, and Filters areas, including drag-and-drop rearrangement and value summarization. That shared model makes an embedded web Pivot easier for spreadsheet users to learn. See Microsoft's guides to creating a PivotTable, arranging the Field List, and controlling layout and subtotals.
1. Install RevoGrid and Pivot
Create a React TypeScript application, configure access to your licensed or trial RevoGrid Pro packages, then install the grid, React wrapper, Pro foundation, and standalone Pivot package:
bash
pnpm add @revolist/revogrid @revolist/react-datagrid \
  @revolist/revogrid-pro @revolist/pivot
Import the commercial styles once in your application entry point:
ts
import '@revolist/revogrid-pro/dist/revogrid-pro.css';
import '@revolist/pivot/styles.css';
The complete repository uses exact package versions and trial aliases so a reproducible checkout does not silently change underneath a benchmark. Follow the official trial installation guide before running it; never commit a registry token.
2. Define typed records, dimensions, and measures
Keep every source row at one consistent grain. Here, one row is one sales observation. Do not mix subtotal rows into the source; Pivot creates them from the raw records.
ts
import { commonAggregators } from '@revolist/revogrid-pro';
import type {
  PivotConfigDimension,
  PivotConfigValue,
} from '@revolist/pivot';

export type SalesRow = {
  id: number;
  region: 'Americas' | 'EMEA' | 'APAC' | 'LATAM' | 'Canada';
  channel: 'Direct' | 'Partner' | 'Marketplace' | 'Retail';
  segment: 'Enterprise' | 'Mid-market' | 'SMB';
  year: 2023 | 2024 | 2025;
  quarter: 'Q1' | 'Q2' | 'Q3' | 'Q4';
  revenue: number;
  profit: number;
  orders: number;
};

function percentile90(values: unknown[]) {
  if (!values.length) return 0;
  const sorted = values.map(Number).sort((a, b) => a - b);
  return sorted[Math.ceil(sorted.length * 0.9) - 1] ?? 0;
}

export const dimensions = [
  { prop: 'region', name: 'Region', fieldGroup: 'Market' },
  { prop: 'channel', name: 'Channel', fieldGroup: 'Market' },
  {
    prop: 'segment',
    name: 'Customer segment',
    fieldGroup: 'Customer',
    filterOptions: ['Enterprise', 'Mid-market', 'SMB'],
  },
  { prop: 'year', name: 'Year', fieldGroup: 'Time' },
  { prop: 'quarter', name: 'Quarter', fieldGroup: 'Time' },
  {
    prop: 'revenue',
    name: 'Revenue',
    fieldGroup: 'Measures',
    aggregators: {
      sum: commonAggregators.sum,
      avg: commonAggregators.avg,
      p90: percentile90,
    },
  },
  {
    prop: 'profit',
    name: 'Profit',
    fieldGroup: 'Measures',
    aggregators: { sum: commonAggregators.sum, avg: commonAggregators.avg },
  },
  {
    prop: 'orders',
    name: 'Orders',
    fieldGroup: 'Measures',
    aggregators: { sum: commonAggregators.sum, avg: commonAggregators.avg },
  },
] satisfies PivotConfigDimension[];

export const values = [
  {
    prop: 'revenue',
    aggregator: 'sum',
    label: 'Revenue',
    format: { preset: 'currency', currency: 'USD', locale: 'en-US' },
  },
  {
    id: 'revenue-p90',
    prop: 'revenue',
    aggregator: 'p90',
    label: 'P90 revenue',
    format: { preset: 'currency', currency: 'USD', locale: 'en-US' },
  },
  {
    prop: 'profit',
    aggregator: 'sum',
    label: 'Profit',
    format: { preset: 'currency', currency: 'USD', locale: 'en-US' },
  },
  {
    prop: 'orders',
    aggregator: 'sum',
    label: 'Orders',
    format: { preset: 'number', locale: 'en-US' },
  },
] satisfies PivotConfigValue[];
The p90 calculation is a real custom aggregator, not a formatted sum. Its stable id distinguishes it from the second use of revenue.
Excel makes the same data-quality point: source data should be organized in columns with one header row, and numeric value fields should not mix text and numbers. Otherwise the default summary can change from Sum to Count. See Create a PivotTable to analyze worksheet data.
3. Configure Rows, Columns, Values, and Filters
Create the initial report as typed configuration:
ts
import type { PivotConfig } from '@revolist/pivot';

export function createPivotConfig(): PivotConfig {
  return {
    dimensions,
    rows: ['region', 'channel'],
    columns: ['year', 'quarter'],
    values,
    filters: ['segment'],
    filterSelections: {
      segment: ['Enterprise', 'Mid-market'],
    },
    totals: {
      subtotals: true,
      grandTotal: true,
      subtotalLabel: 'Subtotal',
      grandTotalLabel: 'All markets',
      suppressSingleChildSubtotals: true,
    },
    collapsed: true,
    groupAggregations: true,
    hasConfigurator: true,
    fieldPanel: {
      visible: true,
      allowFieldDragging: true,
      allowFieldRemoving: true,
      showRowFields: true,
      showColumnFields: true,
      showDataFields: true,
      showFilterFields: true,
    },
  };
}
rows defines the hierarchy down the left. columns generates year and quarter groups across the top. values selects calculations. filters exposes report-level member selection. The field panel lets users drag fields between all four areas without rebuilding the page.
4. Generate deterministic large datasets
A benchmark fixture should be repeatable. Random data can change cardinality and aggregation work between runs, so this generator uses predictable cycles:
ts
const REGIONS = ['Americas', 'EMEA', 'APAC', 'LATAM', 'Canada'] as const;
const CHANNELS = ['Direct', 'Partner', 'Marketplace', 'Retail'] as const;
const SEGMENTS = ['Enterprise', 'Mid-market', 'SMB'] as const;
const QUARTERS = ['Q1', 'Q2', 'Q3', 'Q4'] as const;

export function generateSalesRows(count: number): SalesRow[] {
  return Array.from({ length: count }, (_, index) => {
    const revenue = 250 + ((index * 73) % 9_750);
    const margin = 0.08 + ((index * 17) % 31) / 100;

    return {
      id: index + 1,
      region: REGIONS[index % REGIONS.length],
      channel: CHANNELS[Math.floor(index / REGIONS.length) % CHANNELS.length],
      segment: SEGMENTS[Math.floor(index / 7) % SEGMENTS.length],
      year: (2023 + (index % 3)) as SalesRow['year'],
      quarter: QUARTERS[Math.floor(index / 11) % QUARTERS.length],
      revenue,
      profit: Math.round(revenue * margin * 100) / 100,
      orders: 1 + (index % 12),
    };
  });
}
This fixture controls two different types of scale:
- Source scale: 10,000 to 350,000 input records must be scanned and aggregated.
- Result scale: the unique row and column combinations determine how many Pivot cells and headers exist.
Do not confuse the two. Virtualization keeps the rendered grid DOM small, but it does not make a computationally expensive custom aggregator free. A high-cardinality column axis, many measures, nested totals, and an aggregator that sorts values can dominate the Pivot commit.
5. Build the React analytics component
The component below connects the grid, linked chart, export, persistence, and benchmark controls. The plugins and chart configuration are memoized so React does not create new configuration objects on unrelated state changes. React documents useMemo as a way to cache calculations or object identity between renders, while also warning that it is a performance optimization rather than a semantic guarantee; measure before adding it everywhere. See the official useMemo reference.
tsx
import { useCallback, useEffect, useMemo, useRef, useState } from 'react';
import { RevoGrid } from '@revolist/react-datagrid';
import type { GridPlugin } from '@revolist/revogrid';
import {
  createPivotChartsRenderer,
  createSerializablePivotConfig,
  exportVisiblePivotToCsv,
  mountPivotChart,
  parsePivotStateJson,
  PIVOT_MODEL_CHANGED_EVENT,
  PivotChartsPlugin,
  PivotPlugin,
  serializePivotStateJson,
  type PivotChartRef,
  type PivotChartsConfig,
  type PivotConfig,
} from '@revolist/pivot';
import { createPivotConfig, dimensions } from './pivot-config';
import { generateSalesRows, type SalesRow } from './sales-data';

const STORAGE_KEY = 'sales-analytics:pivot:v1';
const DATASET_SIZES = [10_000, 100_000, 350_000] as const;

type BenchmarkResult = {
  rows: number;
  generationMs: number;
  pivotCommitMs: number;
};

function restoreConfig(): PivotConfig {
  const fallback = createPivotConfig();
  if (typeof window === 'undefined') return fallback;

  try {
    const json = localStorage.getItem(STORAGE_KEY);
    if (!json) return fallback;
    const saved = parsePivotStateJson(json);

    // Rehydrate runtime functions that JSON intentionally omits.
    return {
      ...fallback,
      ...saved,
      dimensions,
      rows: saved.rows ?? fallback.rows,
      columns: saved.columns ?? fallback.columns,
      values: saved.values ?? fallback.values,
    };
  } catch {
    return fallback;
  }
}

export default function SalesAnalytics() {
  const gridRef = useRef<HTMLRevoGridElement>(null);
  const chartHostRef = useRef<HTMLDivElement>(null);
  const chartRef = useRef<PivotChartRef | undefined>(undefined);
  const [rows, setRows] = useState<SalesRow[]>(() => generateSalesRows(10_000));
  const [pivot, setPivot] = useState<PivotConfig>(restoreConfig);
  const [benchmark, setBenchmark] = useState<BenchmarkResult[]>([]);
  const [busy, setBusy] = useState(false);

  const plugins = useMemo(
    () => [PivotPlugin, PivotChartsPlugin] as GridPlugin[],
    [],
  );
  const pivotCharts = useMemo<PivotChartsConfig>(
    () => ({
      renderer: createPivotChartsRenderer(),
      defaultChartType: 'groupedColumn',
      defaultTotals: 'none',
      limits: { maxCategories: 100, maxSeries: 80, maxDataPoints: 2_000 },
    }),
    [],
  );

  useEffect(() => {
    const grid = gridRef.current;
    if (!grid) return;

    const onConfigUpdate = (event: Event) => {
      const patch = (event as CustomEvent<Partial<PivotConfig>>).detail;
      setPivot((current) => {
        const next = { ...current, ...patch, dimensions } as PivotConfig;
        const serializable = createSerializablePivotConfig(next);
        try {
          localStorage.setItem(
            STORAGE_KEY,
            serializePivotStateJson(serializable),
          );
        } catch {
          // Storage can be unavailable in restricted browsing contexts.
        }
        return next;
      });
    };

    grid.addEventListener('pivot-config-update', onConfigUpdate);
    return () => grid.removeEventListener('pivot-config-update', onConfigUpdate);
  }, []);

  useEffect(() => {
    const grid = gridRef.current;
    const container = chartHostRef.current;
    if (!grid || !container) return;
    let active = true;

    const mount = async () => {
      if (!active || chartRef.current) return;
      chartRef.current = await mountPivotChart(grid, {
        container,
        chartType: 'groupedColumn',
        linked: true,
        drillSyncMode: 'both',
        presentation: {
          title: 'Revenue and profit by market',
          legendPosition: 'bottom',
        },
      });
    };
    const onModel = () => void mount();

    grid.addEventListener(PIVOT_MODEL_CHANGED_EVENT, onModel, { once: true });
    void (async () => {
      const installed = await grid.getPlugins();
      const pivotPlugin = installed.find(
        (plugin) => plugin instanceof PivotPlugin,
      ) as PivotPlugin | undefined;
      if (pivotPlugin?.getRuntimeSnapshot()) await mount();
    })();

    return () => {
      active = false;
      grid.removeEventListener(PIVOT_MODEL_CHANGED_EVENT, onModel);
      chartRef.current?.destroy();
      chartRef.current = undefined;
    };
  }, []);

  const exportCsv = useCallback(() => {
    const grid = gridRef.current as
      | (HTMLRevoGridElement & { pinnedBottomSource?: SalesRow[] })
      | null;
    if (!grid) return;

    const csv = exportVisiblePivotToCsv({
      columns: grid.columns ?? [],
      source: grid.source ?? [],
      pinnedBottomSource: grid.pinnedBottomSource ?? [],
      bom: true,
    });
    const url = URL.createObjectURL(
      new Blob([csv], { type: 'text/csv;charset=utf-8' }),
    );
    const link = document.createElement('a');
    link.href = url;
    link.download = 'sales-pivot.csv';
    link.click();
    URL.revokeObjectURL(url);
  }, []);

  const runDataset = useCallback(async (rowCount: number) => {
    const grid = gridRef.current;
    if (!grid) return;
    setBusy(true);
    await new Promise<void>((resolve) => requestAnimationFrame(() => resolve()));

    const generationStart = performance.now();
    const nextRows = generateSalesRows(rowCount);
    const generationMs = performance.now() - generationStart;
    const pivotStart = performance.now();
    const committed = new Promise<number>((resolve) => {
      grid.addEventListener(
        PIVOT_MODEL_CHANGED_EVENT,
        () => resolve(performance.now() - pivotStart),
        { once: true },
      );
    });

    setRows(nextRows);
    const pivotCommitMs = await committed;
    setBenchmark((current) => [
      ...current.filter((result) => result.rows !== rowCount),
      { rows: rowCount, generationMs, pivotCommitMs },
    ].sort((a, b) => a.rows - b.rows));
    setBusy(false);
  }, []);

  return (
    <main style={{ display: 'grid', gap: 12 }}>
      <header style={{ display: 'flex', gap: 8, flexWrap: 'wrap' }}>
        {DATASET_SIZES.map((size) => (
          <button key={size} disabled={busy} onClick={() => void runDataset(size)}>
            Test {size.toLocaleString()} rows
          </button>
        ))}
        <button onClick={exportCsv}>Export CSV for Excel</button>
        <span>{rows.length.toLocaleString()} source rows</span>
      </header>

      {benchmark.length > 0 && (
        <table>
          <thead>
            <tr><th>Rows</th><th>Generate</th><th>Pivot commit</th></tr>
          </thead>
          <tbody>
            {benchmark.map((result) => (
              <tr key={result.rows}>
                <td>{result.rows.toLocaleString()}</td>
                <td>{result.generationMs.toFixed(1)} ms</td>
                <td>{result.pivotCommitMs.toFixed(1)} ms</td>
              </tr>
            ))}
          </tbody>
        </table>
      )}

      <section style={{ display: 'grid', gridTemplateColumns: 'minmax(0, 3fr) minmax(320px, 2fr)', gap: 12 }}>
        <RevoGrid
          ref={gridRef}
          style={{ height: 680 }}
          source={rows}
          pivot={pivot}
          pivotCharts={pivotCharts}
          plugins={plugins}
          readonly
          resize
          filter
          range
          hideAttribution
          theme="compact"
        />
        <div ref={chartHostRef} style={{ minHeight: 420 }} />
      </section>
    </main>
  );
}
The chart is linked: true, so it refreshes from committed Pivot revisions after the source, filters, grouping, or field configuration changes. drillSyncMode: 'both' also keeps supported chart drill navigation and the Pivot frontier coordinated.
6. Export the committed result to Excel or CSV
Export the generated Pivot model, not the original records. The visible model contains generated headers, aggregated values, subtotals, and the pinned grand-total row.
exportVisiblePivotToCsv flattens grouped headers into readable paths and accepts a UTF-8 BOM. That produces a dependable CSV download for Microsoft Excel, Google Sheets, Numbers, and data pipelines.
CSV is the correct default for this tutorial because it proves the Pivot-specific result faithfully. Use RevoGrid Pro's Excel export provider when the acceptance criteria require a native .xlsx workbook with workbook metadata, styled cells, multiple sheets, formulas, or Excel-specific number formats. Treat that as a separate workbook-rendering layer and test the exact Pivot header and total fidelity your product needs.
Microsoft documents a worksheet limit of 1,048,576 rows and separate PivotTable/PivotChart constraints that depend heavily on available memory. A browser Pivot and an Excel workbook also have different memory models, so “Excel can hold the rows” is not a browser performance guarantee. See Excel specifications and limits.
7. Persist the user's Pivot configuration
The application listens to pivot-config-update, updates controlled React state, projects the config into JSON-safe data, and writes a versioned envelope to localStorage.
Two details matter:
- Save configuration, not raw data. Rows normally come from your application or API.
- Rehydrate functions. Custom aggregators, templates, comparators, engine adapters, and DOM mount targets are runtime values and are intentionally absent from JSON.
For production saved views, store the same serialized envelope in your backend with a user ID, workspace ID, schema version, and permission model. Keep local storage as a convenient single-browser preference, not the authoritative shared state.
8. Test 10,000, 100,000, and 350,000 rows
The buttons in the component measure from source replacement to the public pivot-model-changed commit event. Use performance.now() rather than Date.now(); the browser Performance API provides a monotonic high-resolution clock intended for measurement. See MDN's high-precision timing guide.
Run benchmarks in a production build and publish context. React's own performance guidance notes that development measurements can be distorted by Strict Mode and recommends testing production behavior on devices representative of users.
Reference Pivot model run
The table below is a reproducible local reference, not a universal promise. It measures the Pivot model phase for the exact deterministic data shape and configuration in this article: two row dimensions, two column dimensions, one report filter, four measures, row and column totals, and the sorting-based custom p90 aggregator.
| Source rows | Median Pivot model time | Timed samples |
|---|---|---|
| 10,000 | 126.76 ms | 135.68, 121.13, 126.76, 128.20, 118.35 ms |
| 100,000 | 1,202.23 ms | 1,214.76, 1,210.39, 1,196.53, 1,200.70, 1,202.23 ms |
| 350,000 | 4,334.02 ms | 4,332.85, 4,287.80, 4,349.64, 4,340.11, 4,334.02 ms |
Reference environment: MacBook Pro 18,3, Apple M1 Pro with 8 CPU cores and 16 GiB memory, macOS 26.4, Node.js 24.13.0. Each size received one warm-up followed by five timed model builds. Data generation, React reconciliation, browser rendering, chart refresh, download creation, network transfer, and development tooling were excluded. The Pivot result contained 26 rendered row records for this controlled cardinality.
How to interpret the result
- 10,000 rows is comfortably interactive for this configuration on the reference machine.
- 100,000 rows successfully computes client-side, but a roughly 1.2-second model commit needs a visible loading state if users reconfigure frequently.
- 350,000 rows also completes client-side, proving capacity for this data shape, but the roughly 4.3-second custom-aggregation commit is not an instant interaction. Use a worker or server engine when your latency target is tighter.
- Source row count alone is not enough. Unique members, axis depth, measures, filter selectivity, totals, calculation complexity, browser, device memory, and concurrent application work all matter.
The on-page runner is the more important acceptance test because it includes React and browser integration on the user's device. Record at least five runs per size, report the median, test cold and warm paths separately, and keep the dataset/configuration fixed.
9. Decide when to pivot on the server
Keep the client-side engine when the complete dataset already belongs in the browser, interaction latency meets the product target, and the memory cost is acceptable.
Choose RevoGrid's server-side Pivot model when:
- the raw dataset should not be downloaded to the user;
- input size or field cardinality exceeds browser memory targets;
- queries already live in a warehouse, OLAP engine, or analytical API;
- users need security trimming before aggregation;
- the same metric definitions must be authoritative across applications;
- the 100,000- or 350,000-row benchmark misses your interaction budget.
The client still owns field configuration and renders the returned analytical model. The server owns filtering, grouping, aggregation, paging, and drill-down requests. This is a workflow decision, not a failure of virtualization: virtualization reduces rendered DOM, while remote analytics reduces client computation and data transfer.
Across the React Pivot market, this division is familiar. AG Grid documents both client-side Pivot UI and server-side Pivot requests; MUI X describes a controlled Rows/Columns/Values Pivot model; Syncfusion documents virtual scrolling for React Pivot Table; and Flexmonster positions its Pivot component around embedded analytical reports. The consistent lesson is to evaluate the engine, field UI, persistence, chart/export workflow, and data-loading model together—not as isolated checkboxes.
10. Integrate the Pivot Table with Next.js
RevoGrid is interactive and uses browser APIs, custom elements, event listeners, local storage, and a chart container. Put that boundary in a Client Component:
tsx
// app/analytics/SalesAnalytics.tsx
'use client';

export { default } from '@/components/SalesAnalytics';
Next.js says 'use client' declares a client entry point for interactive UI, event handling, state, and browser APIs. It also requires props crossing the server/client boundary to be serializable. See the official use client documentation.
That has three practical consequences:
- Build
PivotConfiginside the Client Component because dimensions can contain aggregator functions. - Pass raw JSON rows or a fetch URL from the Server Component, not plugin classes or callbacks.
- Import the Pro/Enterprise CSS from an allowed global stylesheet entry such as
app/layout.tsx.
If your Next.js setup still evaluates a third-party browser dependency during prerendering, use a small client-only dynamic wrapper:
tsx
// app/analytics/SalesAnalyticsClient.tsx
'use client';

import dynamic from 'next/dynamic';

export default dynamic(
  () => import('@/components/SalesAnalytics'),
  { ssr: false, loading: () => <p>Loading analytics…</p> },
);
Keep the rest of the page as a Server Component for metadata, static explanation, and data-access orchestration. Only the interactive Pivot surface needs the client boundary.
Production checklist
Before shipping, verify more than the happy-path screenshot:
- Use stable field IDs and keep display labels separate from source keys.
- Validate numeric measures before they reach the aggregator.
- Put an explicit height on both grid and chart containers.
- Persist
pivot-config-updateonly after validating schema/version ownership. - Restore runtime functions after parsing saved JSON.
- Export the committed Pivot model, including
pinnedBottomSourcefor grand totals. - Benchmark a production build on low-, median-, and high-spec target devices.
- Test high-cardinality fields, empty/null members, filters, and repeated measures.
- Show progress and prevent overlapping dataset switches during long commits.
- Move aggregation to the server when data governance, memory, or latency requires it.
- Destroy linked chart refs and remove event listeners when React unmounts.
FAQ
React Pivot Table FAQ
Next steps
Run the live Pivot demo, clone the complete GitHub repository, and use the React Pivot Table Component page to evaluate the commercial package. For the underlying concepts before implementation, read What Is a Pivot Table?.