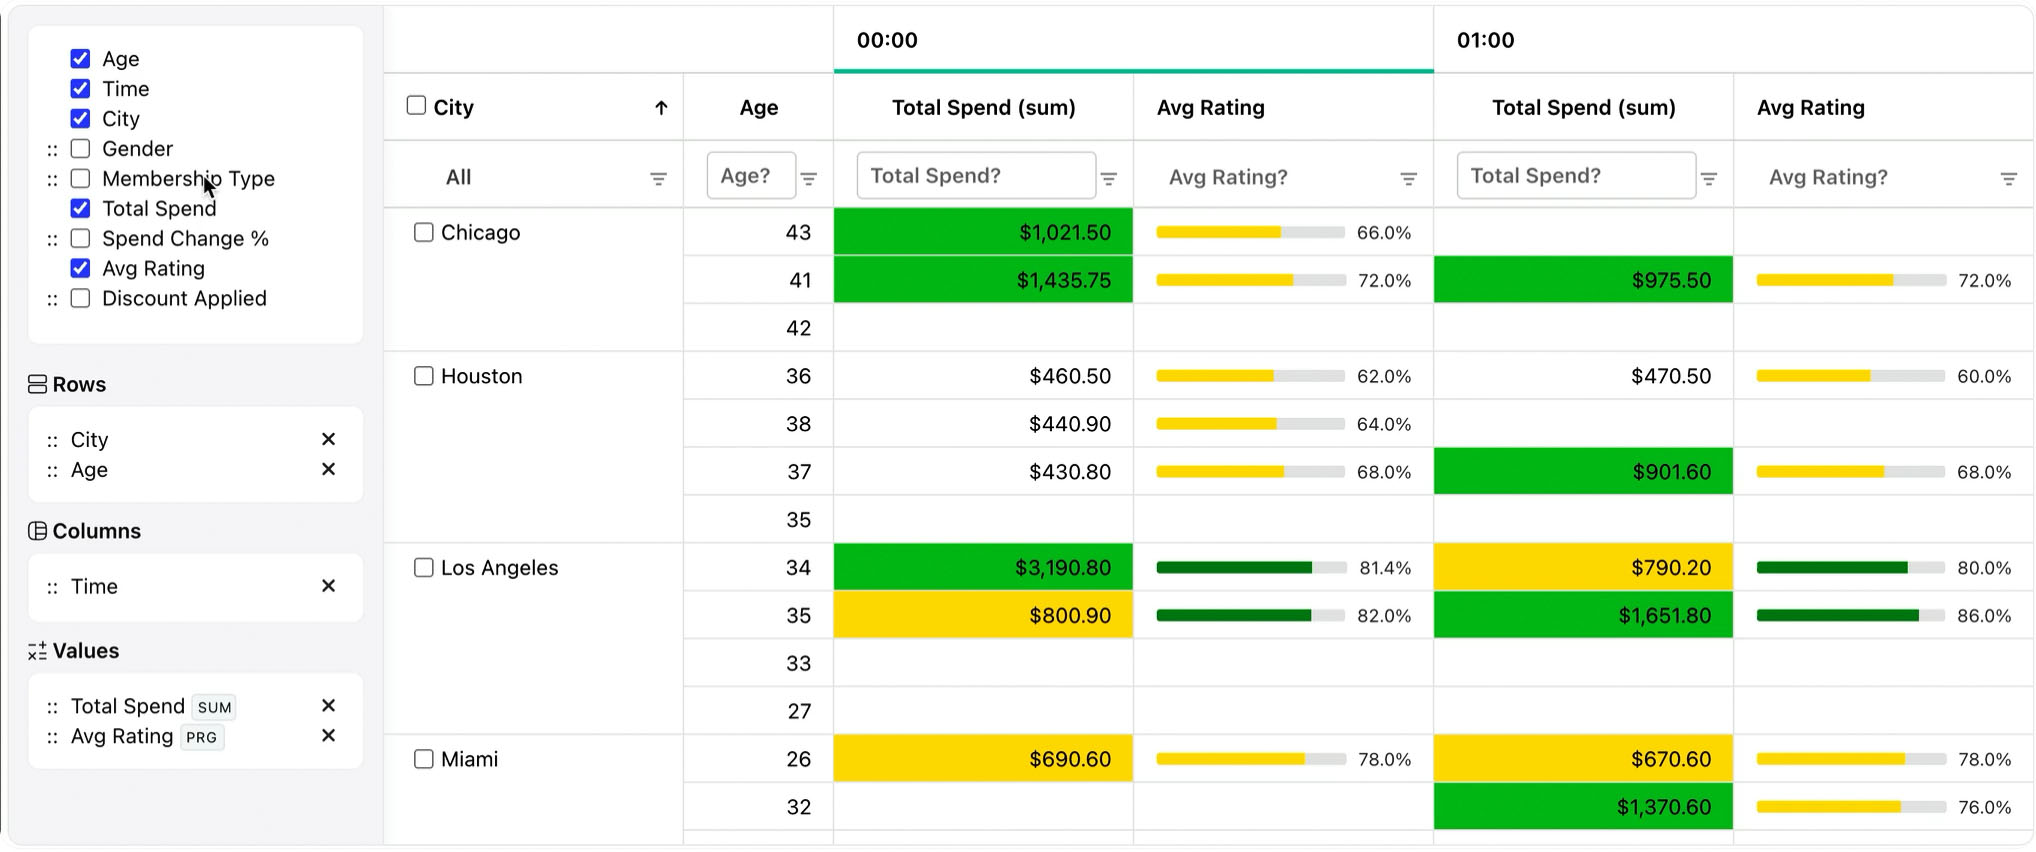
Embed self-service Pivot analytics directly in a React product. RevoGrid Pivot gives users an Excel-familiar field workflow while your application keeps control of data, permissions, saved views, navigation, and surrounding UI.
RevoGrid Pivot is built for SaaS products, finance and operations tools, admin systems, customer portals, and embedded reporting screens where a fixed dashboard is not enough.
Users can reshape one analytical model at runtime:
drag fields between Rows, Columns, Values, and Filters;
nest row and column hierarchies;
choose standard or application-defined aggregations;
expand, collapse, filter, sort, and drill into grouped results;
display row subtotals, column subtotals, and grand totals;
create linked Pivot charts from the committed analytical result;
export report data and persist reusable layouts;
keep computation in the browser or delegate it to a server-side engine.
React owns the controlled application state and product shell. RevoGrid owns the virtualized tabular viewport and Pivot runtime. This separation keeps the integration idiomatic without asking React to reconcile every analytical cell as an ordinary component tree.
For the complete application—including typed data generation, repeated measures, a custom percentile aggregation, synchronized charts, Excel-friendly export, state restoration, and 10K/100K/350K measurements—follow How to Build a React Pivot Table for Large Datasets.
Choose the execution model based on data ownership and measured product requirements.
Use client-side Pivot when
Use server-side Pivot when
The complete dataset is already available in the browser.
Raw records should remain behind authorization or data-governance boundaries.
Field changes meet the latency target on representative devices.
Dataset size, cardinality, or custom calculations exceed browser budgets.
Users need offline or zero-round-trip exploration.
Metrics must be shared and authoritative across applications.
The application can afford the source data's memory footprint.
An existing warehouse, cube, or analytical service should perform aggregation.
RevoGrid uses the same Rows, Columns, Values, Filters, totals, and drill concepts across both paths. That allows a product to begin with local analysis and adopt a remote engine without replacing the entire React surface.
The component uses a familiar field-list mental model, but it remains an embedded web analytics surface rather than a spreadsheet clone.
Use it when users need to:
rearrange the question they are asking;
compare multiple measures across nested dimensions;
keep filters visible in the application workflow;
move from a Pivot result to a linked chart;
save a report layout for later;
download the result for finance, audit, or offline follow-up.
The Pivot-specific CSV helper exports generated headers, values, and pinned totals in a format Excel can open. Native XLSX workflows can use RevoGrid Pro's Excel provider when workbook styling, multiple worksheets, formulas, or other Excel metadata is part of the acceptance criteria.
“Supports large data” is incomplete without a data shape and measurement method. During a trial, test:
10,000, 100,000, and your maximum expected source row count;
realistic unique values on every row and column dimension;
the actual number and complexity of measures;
filters, subtotals, grand totals, and drill state;
cold load, repeated field changes, chart refresh, and export;
median user hardware, not only a developer workstation.
The companion tutorial publishes one reference run through 350,000 rows and explains why source size, result cardinality, and aggregation complexity must be reported separately. RevoGrid's client-side capability is useful, but a production decision should be based on your own service-level target and representative data.
For Next.js App Router, place the grid in a Client Component because it uses event handlers and browser APIs. Build function-bearing Pivot dimensions inside that boundary instead of passing aggregators from a Server Component. Keep metadata, static explanation, and server data access outside the client bundle where possible.
The React wrapper does not create a separate Pivot implementation. It binds React properties and refs to the same RevoGrid custom-element and plugin runtime used across frameworks. This is useful for teams that want React integration without maintaining framework-specific analytical behavior.
RevoGrid Pivot is included in RevoGrid Pro Advanced. RevoGrid Core remains the MIT-licensed grid foundation; the Pivot engine, configurator, chart workflow, export/state helpers, and remote analytical contracts are commercial capabilities.
Yes. Use @revolist/react-datagrid for property and ref integration, then install Pivot through the normal RevoGrid plugin contract.
Yes. Enable the Pivot configurator or field panel and persist controlled changes from pivot-config-update.
Yes. Dimensions can register application-defined aggregator functions, and a field can appear more than once in Values with a stable measure ID.
The Pivot helper produces Excel-friendly CSV from the committed analytical model. Use the Pro Excel layer when native XLSX workbook features are required.
Yes. RevoGrid Pivot exposes server-side contracts for application-owned analytical APIs, warehouses, OLAP services, and custom backends.
Both plans include advanced grid capabilities. Pro Advanced adds priority support, original private source repository access, and the JavaScript Pivot Table, Kanban, Gantt, and Scheduler.
Yes. Start the 30-day trial immediately from the public trial registry—no npm login or token, license key, form, or approval email is required. You can also clone and run the public starter right away.
Pro Lite includes typed private npm packages and development examples. Pro Advanced also includes access to the original private source repository.