
Yes. Import the RevoGrid Angular wrapper into a standalone component and pass Pivot through the standard plugin and property contracts.
Angular Pivot Table Component
Embed self-service Pivot analytics in an Angular application without building a reporting engine around a static table. RevoGrid Pivot supplies the analytical runtime and virtualized viewport while Angular controls signals, permissions, saved views, services, and the surrounding product workflow.
View the live Pivot demo · Get Pro Trial · Inspect the Angular example
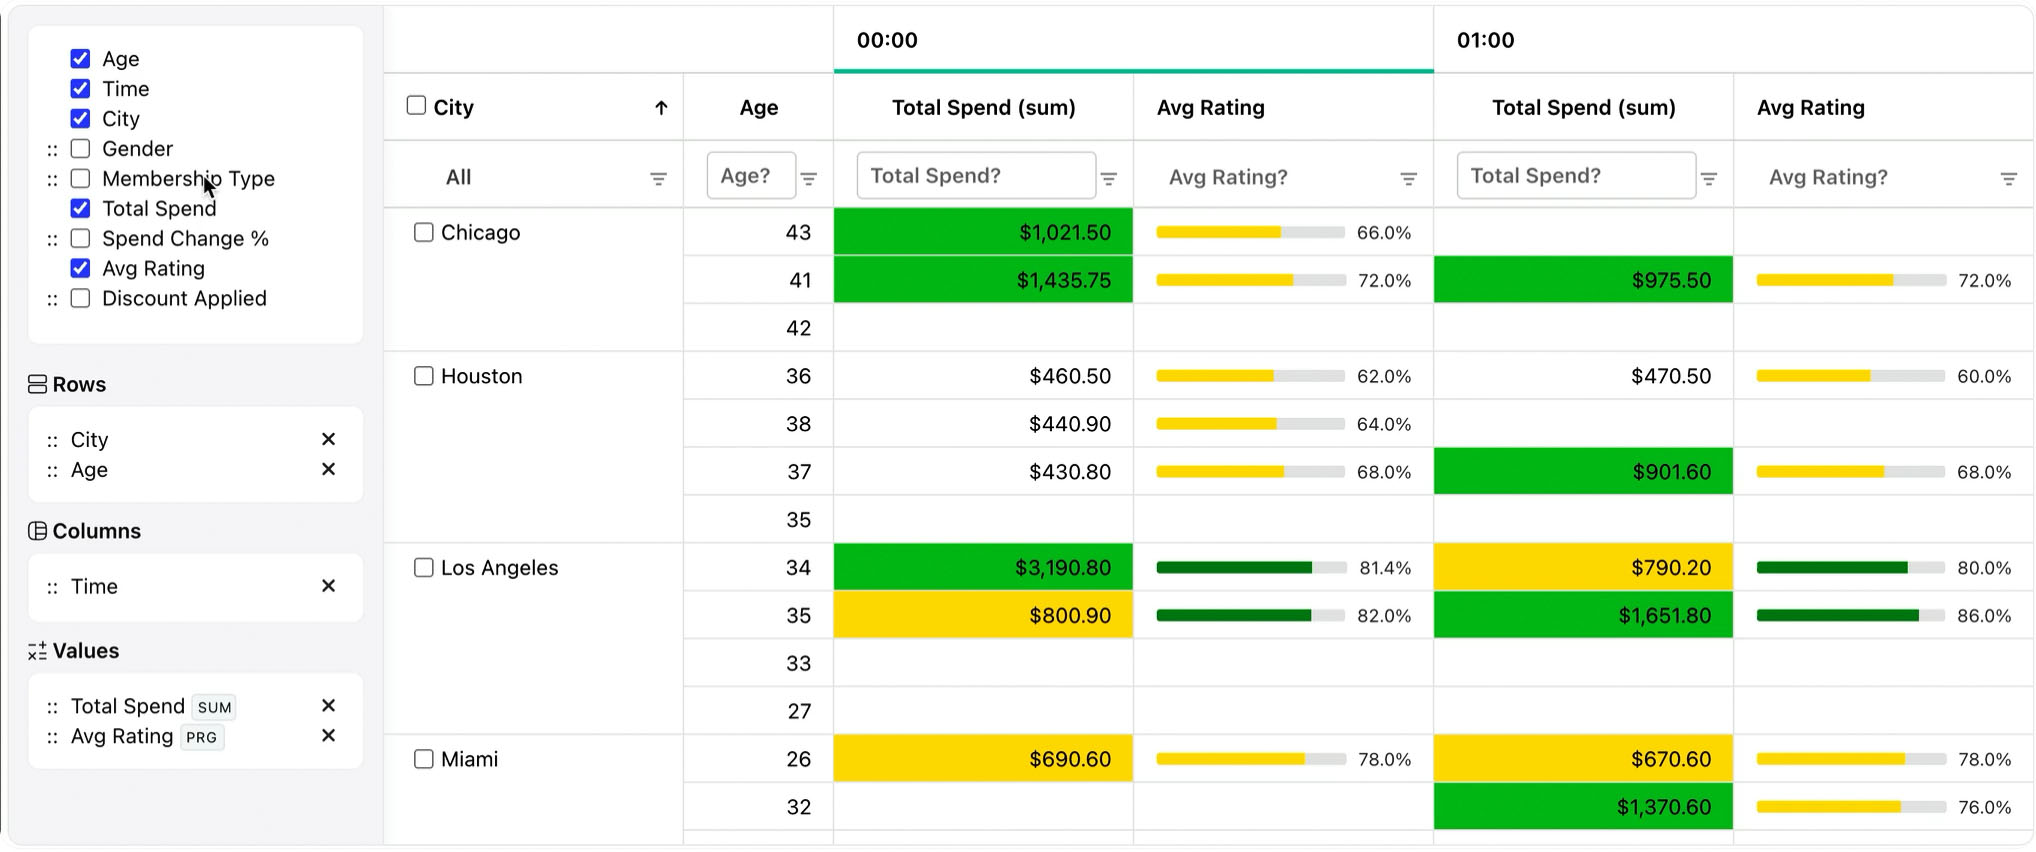
An Angular Pivot Table for governed applications
RevoGrid Pivot suits finance and operations tools, enterprise portals, admin systems, and embedded reporting surfaces where users need to rearrange an analytical question while the application preserves authorization and business rules.
Users can move fields among Rows, Columns, Values, and Filters; nest hierarchies; select standard or custom calculations; inspect subtotals and grand totals; synchronize charts; export the committed result; and restore saved layouts. Client-side and server-side models share the same configuration concepts.
Angular signals make the source rows and Pivot configuration explicit dependencies. OnPush change detection keeps the host component efficient, while RevoGrid handles analytical rendering outside Angular's ordinary component tree.
Component capabilities
| Capability | Angular product value |
|---|---|
Typed PivotConfig | Keep dimensions, measures, totals, filters, and drill state inside TypeScript contracts. |
| Drag-and-drop fields | Allow self-service reporting while handling updates through normal Angular events. |
| Custom aggregations | Add domain metrics alongside standard sum, average, count, min/max, and median. |
| Totals and hierarchy | Render nested row and column groups with configurable subtotals and grand totals. |
| Linked Pivot charts | Coordinate analytical charts with signal-owned configuration and source updates. |
| Export and persistence | Export Excel-friendly CSV and save a versioned, JSON-safe Pivot layout. |
| Client- or server-side | Analyze permitted local data or connect the same surface to a governed backend. |
Angular integration shape
Use the standalone wrapper component, bind source and configuration as properties, and replace the signal value when the field panel emits an updated configuration:
ts
import {
  ChangeDetectionStrategy,
  Component,
  computed,
  signal,
} from '@angular/core';
import { RevoGrid } from '@revolist/angular-datagrid';
import {
  PivotPlugin,
  type PivotConfig,
} from '@revolist/pivot';

@Component({
  selector: 'revenue-pivot',
  standalone: true,
  imports: [RevoGrid],
  changeDetection: ChangeDetectionStrategy.OnPush,
  template: `
    <revo-grid
      style="height: 680px"
      [source]="rows()"
      [pivot]="pivot()"
      [plugins]="plugins"
      [readonly]="true"
      [resize]="true"
      [filter]="true"
      [hideAttribution]="true"
      (pivot-config-update)="updatePivot($any($event))"
    ></revo-grid>
  `,
})
export class RevenuePivotComponent {
  readonly rows = signal<Record<string, unknown>[]>([]);
  readonly plugins = [PivotPlugin];
  private readonly config = signal<PivotConfig>({
    dimensions: [
      { prop: 'region', name: 'Region' },
      { prop: 'quarter', name: 'Quarter' },
      { prop: 'revenue', name: 'Revenue' },
    ],
    rows: ['region'],
    columns: ['quarter'],
    values: [{ prop: 'revenue', aggregator: 'sum' }],
    totals: { subtotals: true, grandTotal: true },
    hasConfigurator: true,
    fieldPanel: { visible: true, allowFieldDragging: true },
  });
  readonly pivot = computed(() => this.config());

  updatePivot(event: CustomEvent<PivotConfig>) {
    this.config.set(event.detail);
  }
}
The complete Angular implementation adds custom aggregations, linked charts, Excel-friendly export, state restoration, and 10K/100K/350K evaluation controls.
Client-side or server-side Pivot
| Use client-side Pivot when | Use server-side Pivot when |
|---|---|
| The complete authorized dataset is available in the browser. | Raw records must remain behind security or governance boundaries. |
| Measured field changes meet the product latency target. | Cardinality or calculations exceed browser CPU and memory budgets. |
| Users need zero-round-trip or offline exploration. | Metrics must remain authoritative across multiple products. |
| Local memory use is acceptable on supported devices. | An existing warehouse or analytical service should aggregate data. |
Server execution changes where the model is calculated, not how Angular presents Rows, Columns, Values, Filters, totals, and drill controls.
Signals, OnPush, and Angular SSR
Keep source arrays and PivotConfig in signals, then expose derived grid input through computed. Use effect only for side effects such as local persistence. Replace arrays and configuration objects instead of relying on deep mutation.
For Angular SSR, render page metadata and the surrounding shell on the server, but initialize the grid, browser storage, event listeners, and charts only in the browser. Destroy linked chart references and external subscriptions in ngOnDestroy. When data is governed or too large to serialize, inject an analytical service rather than embedding raw rows into the rendered page.
Excel-oriented reporting
Export the committed Pivot model rather than the original source array. The CSV helper includes generated headers, aggregated values, and pinned totals in an Excel-friendly file. Use the Pro Excel layer when requirements include native XLSX formatting, multiple worksheets, formulas, or workbook metadata.
Large-data evaluation
Test 10,000, 100,000, and your maximum expected row count with realistic dimension cardinality, measures, filters, totals, drill state, chart updates, and export. Measure production builds on representative hardware. Virtual rendering reduces DOM work, but the Angular boundary does not remove data-transfer, aggregation, or memory costs.
Package and licensing
RevoGrid Pivot is included in RevoGrid Pro Advanced. RevoGrid Core remains MIT licensed; Pivot configuration, analytical calculation, charts, export/state helpers, and server-side contracts are commercial capabilities.
Use the publicly installable trial to test your data, SSR boundary, services, export requirements, and server architecture. Review the Pivot overview, pricing, live demo, and complete repository.
FAQ
Angular Pivot Table Component FAQ
Evaluate the Angular Pivot Table
Open the live demo, inspect the Angular source, or get the Pro trial.