
Revenue Analytics with RevoGrid Pivot
Revenue reporting becomes difficult when one fixed dashboard must answer every follow-up question. A sales leader starts with total revenue, then asks which region changed, whether the result came from online or enterprise sales, and how the pattern developed through the year. Analysts often respond by creating another export, worksheet, or chart. The numbers may be correct, but the workflow fragments quickly.
RevoGrid Pivot turns the same source records into an interactive analytical model inside the product. Users can reorganize fields, expand a market into channels, compare periods, filter a cohort, and inspect totals without leaving the reporting surface. The result is useful for SaaS analytics, sales operations, management reporting, and internal BI applications where the application must retain control of data and permissions.
RevoGrid Pivot is included in RevoGrid Pro Advanced.
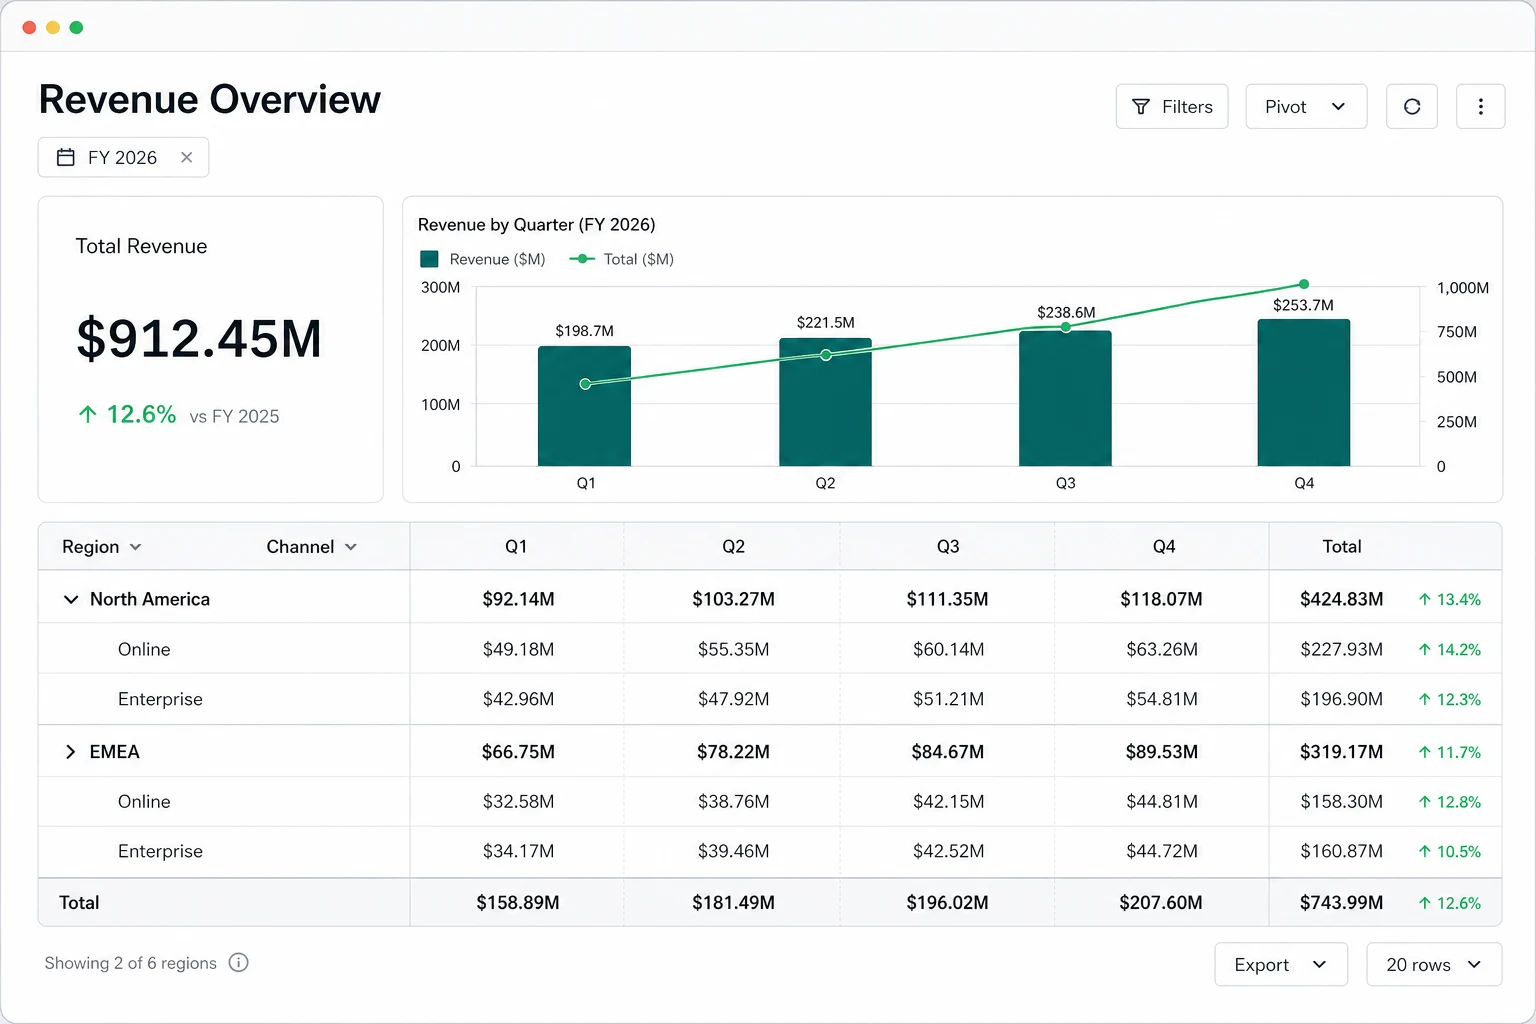
A production-style revenue view: the table organizes regions and channels across Q1–Q4, while the adjacent chart summarizes the same quarterly context. Growth percentages are application-defined measures calculated from governed period data.
The business problem: one number, many explanations
A useful revenue view must preserve several contexts at once. Executives need the consolidated number. Regional leaders need their own market. Channel owners need a contribution breakdown. Finance needs periods, consistent currency treatment, and a traceable definition of revenue. Product teams need all of that to fit an application workflow rather than an analyst-only tool.
The underlying dataset should stay at a consistent grain—for example, one order line, invoice line, or daily sales observation per row. Dimensions describe each observation, such as region, channel, fiscal year, quarter, segment, or product family. Measures carry numeric facts such as booked revenue, recognized revenue, discount, quantity, or order count. The Pivot model groups and aggregates those records into the requested view; source rows should not be preloaded with presentation subtotals.
This separation matters. It lets a user move from “How much revenue did we earn?” to “Which EMEA channel drove Q4?” without requesting a differently shaped endpoint or duplicating summary rows in the source.
Recommended Pivot model
The initial view should answer a common management question while leaving room for exploration.
| Pivot area | Recommended fields | Why it belongs there |
|---|---|---|
| Rows | Region, then Channel | Creates an expandable hierarchy from market totals to the operating route that produced them. |
| Columns | Fiscal year, then Quarter | Preserves year context and makes sequential quarters easy to compare. |
| Values | Revenue sum, order count, optional application-defined growth measure | Shows scale, activity, and change without mixing dimensions into the numeric result. |
| Filters | Customer segment, product family, currency, sales team | Lets users narrow the cohort while keeping the report layout stable. |
Start with the fewest fields needed to answer the primary question. A default view with every available dimension creates a large result and makes the hierarchy harder to read. Additional dimensions can remain available in the field configurator for users who need deeper analysis.
A realistic user workflow
Imagine a revenue operations lead opening the FY2026 report. The KPI shows total revenue and the chart shows the quarterly trajectory. The table begins with region-level totals, so the lead can compare North America, EMEA, and other markets without scanning individual transactions.
The lead notices that EMEA finishes strongly in Q4 and expands the region. The hierarchy reveals Online and Enterprise channel contributions. A customer-segment filter isolates enterprise accounts, and the table recalculates the grouped result, subtotals, and grand total for that cohort. The lead can then switch the row order, place Channel before Region, or add Product Family to see whether the same channel pattern holds across product lines.
The reporting application can persist a useful configuration as a saved view, subject to the product's own storage, naming, and access rules. A manager returns to a familiar layout; an analyst can create a more detailed variation without requiring a new hard-coded report.
Keep linked charts in the same analytical context
A chart is most useful when it explains the current Pivot result rather than presenting a separate, stale query. RevoGrid Pivot can project the committed analytical model into linked charts. When data, field configuration, filters, or supported drill state changes, the chart can refresh from the same Pivot revision.
For the default revenue view, a quarterly column chart communicates period scale quickly. A line can emphasize trend, while the Pivot table preserves the exact region and channel values behind it. Keep the chart selective: a consolidated quarter series or the currently explored branch is often clearer than drawing every cell in a high-cardinality result.
The host application still owns the surrounding dashboard decisions—titles, annotations, permissions, navigation, and which chart best matches the question. The Pivot model provides the synchronized analytical result.
Choose metrics and aggregations deliberately
Revenue usually begins with sum, but a credible report needs explicit definitions:
- Revenue: sum the approved revenue field, with the intended booked or recognized basis.
- Orders: count records only when one source row equals one order; otherwise aggregate a dedicated order measure or use an application-defined calculation.
- Average order value: calculate from aggregated revenue and order counts under the application's metric rules rather than averaging row-level ratios blindly.
- Growth and percent change: implement these as application-defined measures or custom aggregations using governed current- and prior-period inputs. Do not assume a displayed percentage is a built-in Pivot calculation.
Formatting should communicate, not redefine, a metric. Currency symbols, decimal precision, and compact millions improve readability, but currency conversion and fiscal-period mapping belong in the application's data or analytical layer.
Decide the client-versus-server boundary
Use client-side Pivot when the complete authorized dataset is already in the browser, representative devices meet the interaction target, and the source's memory footprint is acceptable. This model gives field changes and drill interactions a direct, zero-round-trip feel.
Use a server-side analytical engine when raw records must remain behind governance boundaries, data volume or cardinality exceeds browser budgets, or metric definitions must be authoritative across products. The server can own filtering, aggregation, permissions, currency normalization, and prior-period calculations, while the application presents the resulting analytical model.
The choice should follow measurement rather than a headline row count. Test realistic cardinality, measures, filters, totals, field changes, chart refreshes, and export on the devices your users actually have.
Implementation and evaluation checklist
- Confirm the source grain and remove presentation subtotal rows from raw data.
- Document revenue basis, fiscal calendar, currency policy, and access rules.
- Define a focused default Rows, Columns, Values, and Filters layout.
- Validate subtotals and grand totals against an authoritative control report.
- Treat growth, margin, and ratio metrics as governed application calculations.
- Test expansion, collapse, filtering, field rearrangement, saved views, charts, and export.
- Measure cold load and repeated interactions with production-shaped data.
- Choose client or server execution from latency, memory, governance, and metric-authority requirements.
- Verify responsive layout, keyboard use, readable labels, and empty or partial-data states.
Build the revenue workspace
Review the Pivot product overview, explore the interactive Pivot demo, and get the Pro Advanced trial to evaluate your own revenue model.
Explore other Pivot use cases
Continue with Customer Analytics or Financial Reporting.