
Financial Reporting with RevoGrid Pivot
Finance teams need reports that are controlled for review and flexible for investigation. A static P&L becomes less helpful when a controller must isolate an entity, expand a department, or explain why actual spend moved away from plan.
RevoGrid Pivot turns the governed records supplied by your application into an interactive reporting surface. Users can rearrange fields, filter periods and entities, expand hierarchies, inspect subtotals and grand totals, and create a linked chart from the active Pivot result. Pivot is a commercial capability included in RevoGrid Pro Advanced.
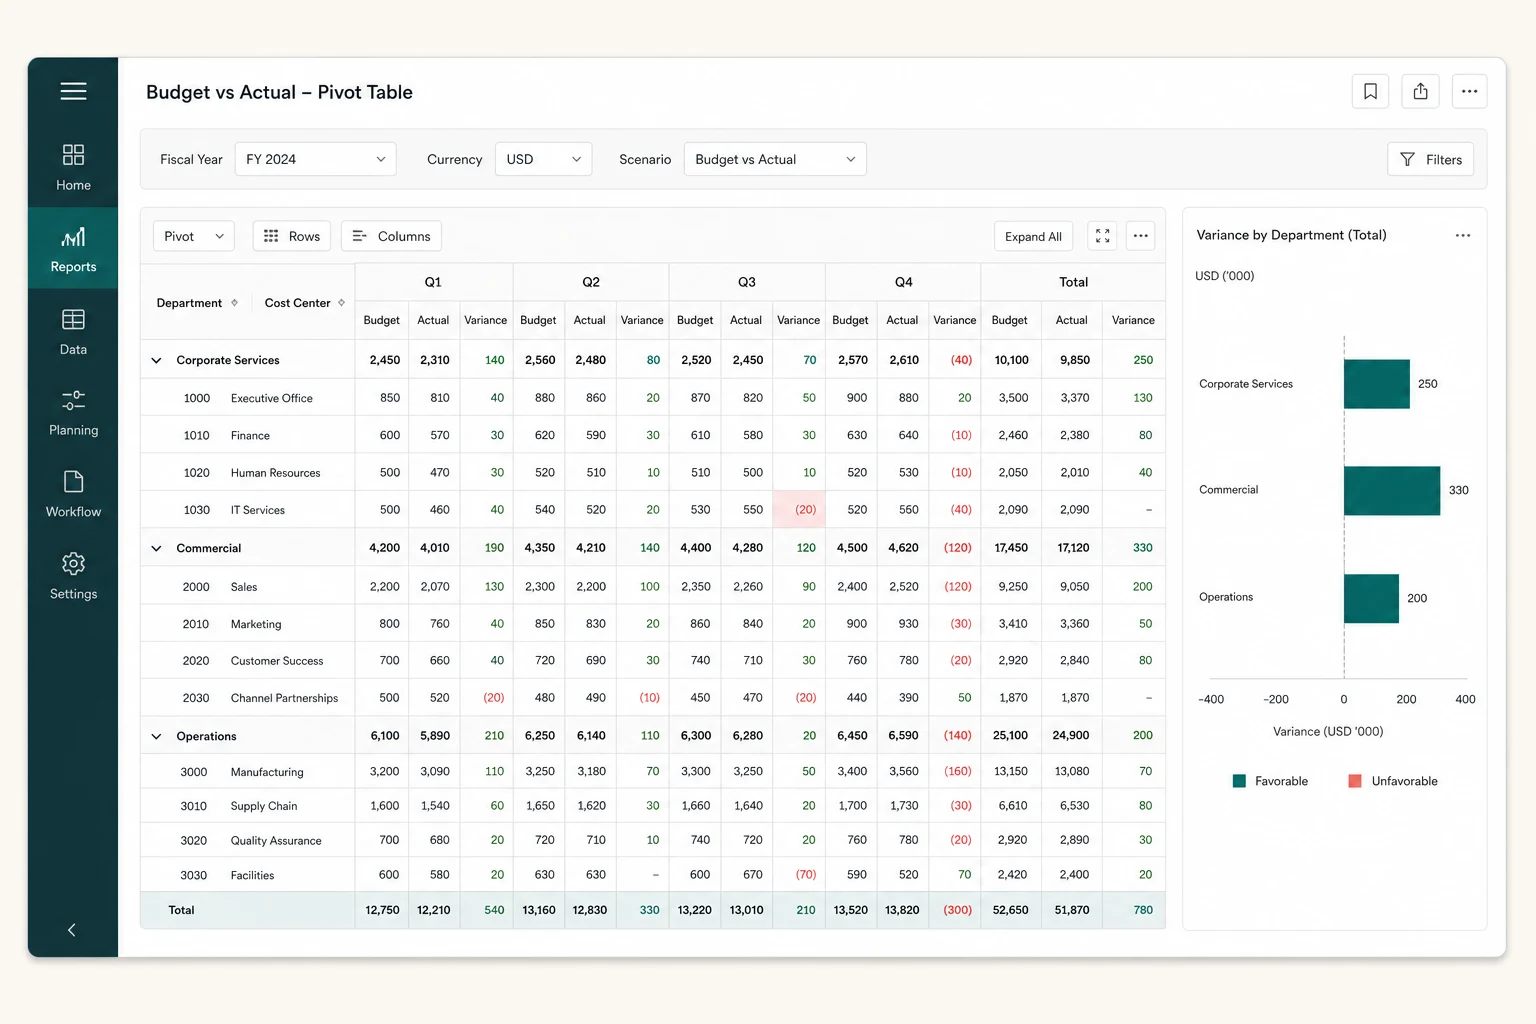
The business problem: explain the variance, not just the total
A useful financial view connects a consolidated number to the operating structure behind it. It should answer several questions without producing a new spreadsheet for each one:
- Where did actuals exceed budget this quarter?
- Is the variance isolated to one department, cost center, account, or entity?
- Is the result driven by timing, volume, currency movement, or a mapping change?
- Can a reviewer reproduce the same view with the same filters and reporting period?
Pivot is the exploration layer, not the accounting system. Your ledger, planning platform, consolidation service, or warehouse remains authoritative for mappings, approved budgets, eliminations, exchange rates, and period locks. The application supplies an analysis-ready model; RevoGrid presents it.
Recommended Pivot model
Start with grain before fields. A practical source has one row per entity, period, scenario, account, department, cost center, and currency context. A tidy Scenario dimension containing Budget and Actual makes period comparisons easy to arrange, although separate approved measures can also match the upstream model.
| Pivot area | Recommended fields | Purpose |
|---|---|---|
| Rows | Department → Cost center → Account | Creates an expandable operating and account hierarchy. |
| Columns | Fiscal year → Quarter or month → Scenario | Places Budget and Actual side by side within each period. |
| Values | Reporting amount (sum); optional quantity or approved KPI | Aggregates additive, normalized measures at every intersection. |
| Filters | Entity, ledger, version, currency view, period status | Narrows the report without changing its structural layout. |
Only put additive values into a simple sum. Ratios and per-unit metrics often need an application-defined aggregation or a value calculated from aggregated components. Document each measure's sign convention and subtotal behavior.
A realistic budget-versus-actual workflow
- The application loads the approved budget version and posted actuals for the selected fiscal window. It also supplies stable IDs and display labels for entities, accounts, departments, and cost centers.
- The report opens at a consolidated department level, with months or quarters grouped in columns and grand totals visible. Filters can default to the reporting entity, ledger, and closed periods relevant to the user.
- A controller expands an unfavorable department, then its cost centers and accounts. RevoGrid's nested rows, parent aggregations, collapsible column groups, and multi-row headers keep the path and period structure readable.
- The controller changes a filter or field arrangement to test an explanation. The active Pivot model updates, and a linked variance chart can follow the same analytical context.
- The application saves the layout separately from the financial facts. A later session can restore the versioned Pivot state after validating that the user still has access to the underlying entities and dimensions.
One embedded surface can support an executive rollup and detailed review. Drill-through to journal documents and its permissions still belong to the host application.
Variance calculations and finance-aware formatting
Budget variance is domain-specific. For expense accounts, Budget - Actual may make positive values favorable; for revenue, teams often use Actual - Budget. Percentage variance also needs explicit zero-budget behavior. Calculate these fields upstream or register application-defined aggregation logic only when the calculation remains mathematically valid across the chosen grain.
Formatting is likewise application-owned. RevoGrid supports numeric column types, custom cell properties, and heatmap-style emphasis, but your product should decide currency symbols, decimal precision, negative-number notation, materiality thresholds, and favorable-versus-unfavorable colors. Do not encode meaning with color alone; retain signed values, labels, or icons for accessibility and print workflows.
Hierarchies, totals, and linked charts
Department and cost-center rows work well as an expandable hierarchy. Periods can form nested year, quarter, and month column groups. Subtotals help users keep context while investigating, and a grand total provides the consolidated result. Validate subtotal behavior for every metric: additive currency values are straightforward, while percentages and ratios may require recomputation rather than summation.
Linked Pivot charts are useful for explaining shape: monthly variance by department, actual versus budget across quarters, or contribution by cost center. The chart reflects the active Pivot result as fields, filters, and drill state change. Treat it as an analytical companion, not a replacement for the exact values and reconciliation controls in the grid.
Multi-currency reporting without false totals
Never sum heterogeneous transaction currencies into a figure labeled simply “Total.” Supply both the original amount and an approved reporting-currency amount, together with currency code, rate type, rate date or period, and conversion version where required. Then aggregate the normalized reporting amount and expose currency view as a controlled filter.
Translation, remeasurement, eliminations, and constant-currency analysis belong in your finance or analytical layer unless the application has a tested, governed implementation. The Pivot can present those approved results; it should not silently choose rates or invent consolidation policy.
Governance, audit, and export boundaries
RevoGrid does not replace row-level authorization, approval workflows, close controls, data lineage, or an audit ledger. Enforce access before records reach the browser, log report parameters in the application, and preserve source version identifiers when reproducibility matters.
For handoff, the Pivot-specific export workflow produces CSV or TSV from the committed analytical result, and layout state can be saved as versioned JSON. CSV is Excel-friendly, but it is not a styled native workbook. If acceptance criteria require formulas, multiple worksheets, workbook metadata, or styled cells, evaluate a native XLSX workflow through the appropriate Pro Excel layer and test the exact finance template.
Choose the client or server boundary deliberately
Client-side Pivot is a strong fit when authorized source rows can be transferred safely, fit the browser's memory budget, and recalculate within the product's latency target. Virtual rendering limits mounted DOM cells, but it does not remove transfer, storage, sorting, or aggregation cost.
Use an application-owned server model when datasets are too large or sensitive, entitlements must be enforced before aggregation, or a warehouse/cube already owns financial calculations. Rows, Columns, Values, Filters, totals, and drill concepts can remain consistent while computation moves behind an analytical API.
Implementation and evaluation checklist
- Define source grain, stable dimension IDs, period calendar, signs, scenario versions, and measure formulas.
- Reconcile leaf values, subtotals, and grand totals against an authoritative finance report.
- Test empty budgets, late adjustments, closed periods, missing mappings, and organizational changes.
- Validate currency conversion and ensure mixed currencies cannot produce misleading totals.
- Apply authorization before data transfer and re-check access when restoring saved layouts.
- Measure production builds with realistic row counts, dimension cardinality, filters, drill state, charts, and export.
- Specify whether CSV/TSV is sufficient or a native XLSX process is required.
- Test keyboard use, non-color variance cues, narrow screens, and long account labels.
Open the Pivot product overview, explore the live Pivot demo, or get the Pro Advanced trial to evaluate a representative financial dataset.
Explore other Pivot use cases
See how teams build Revenue Analytics and Customer Analytics with the same Pivot foundation.