
The Human Benefits of an Embedded Gantt Chart
A plan can be technically correct and still be hard to live with. Dates sit in one tool, operational records in another, and the real story survives in messages, meetings, and one experienced person's memory. People spend energy rebuilding context before they can make a decision.
A useful Gantt chart does more than draw bars. It gives a team one visual explanation of the work: what must happen, when it can happen, who or what it depends on, and what a change will affect. When that schedule is embedded in the product people already use, the plan stays close to the work instead of becoming a separate reporting ritual.
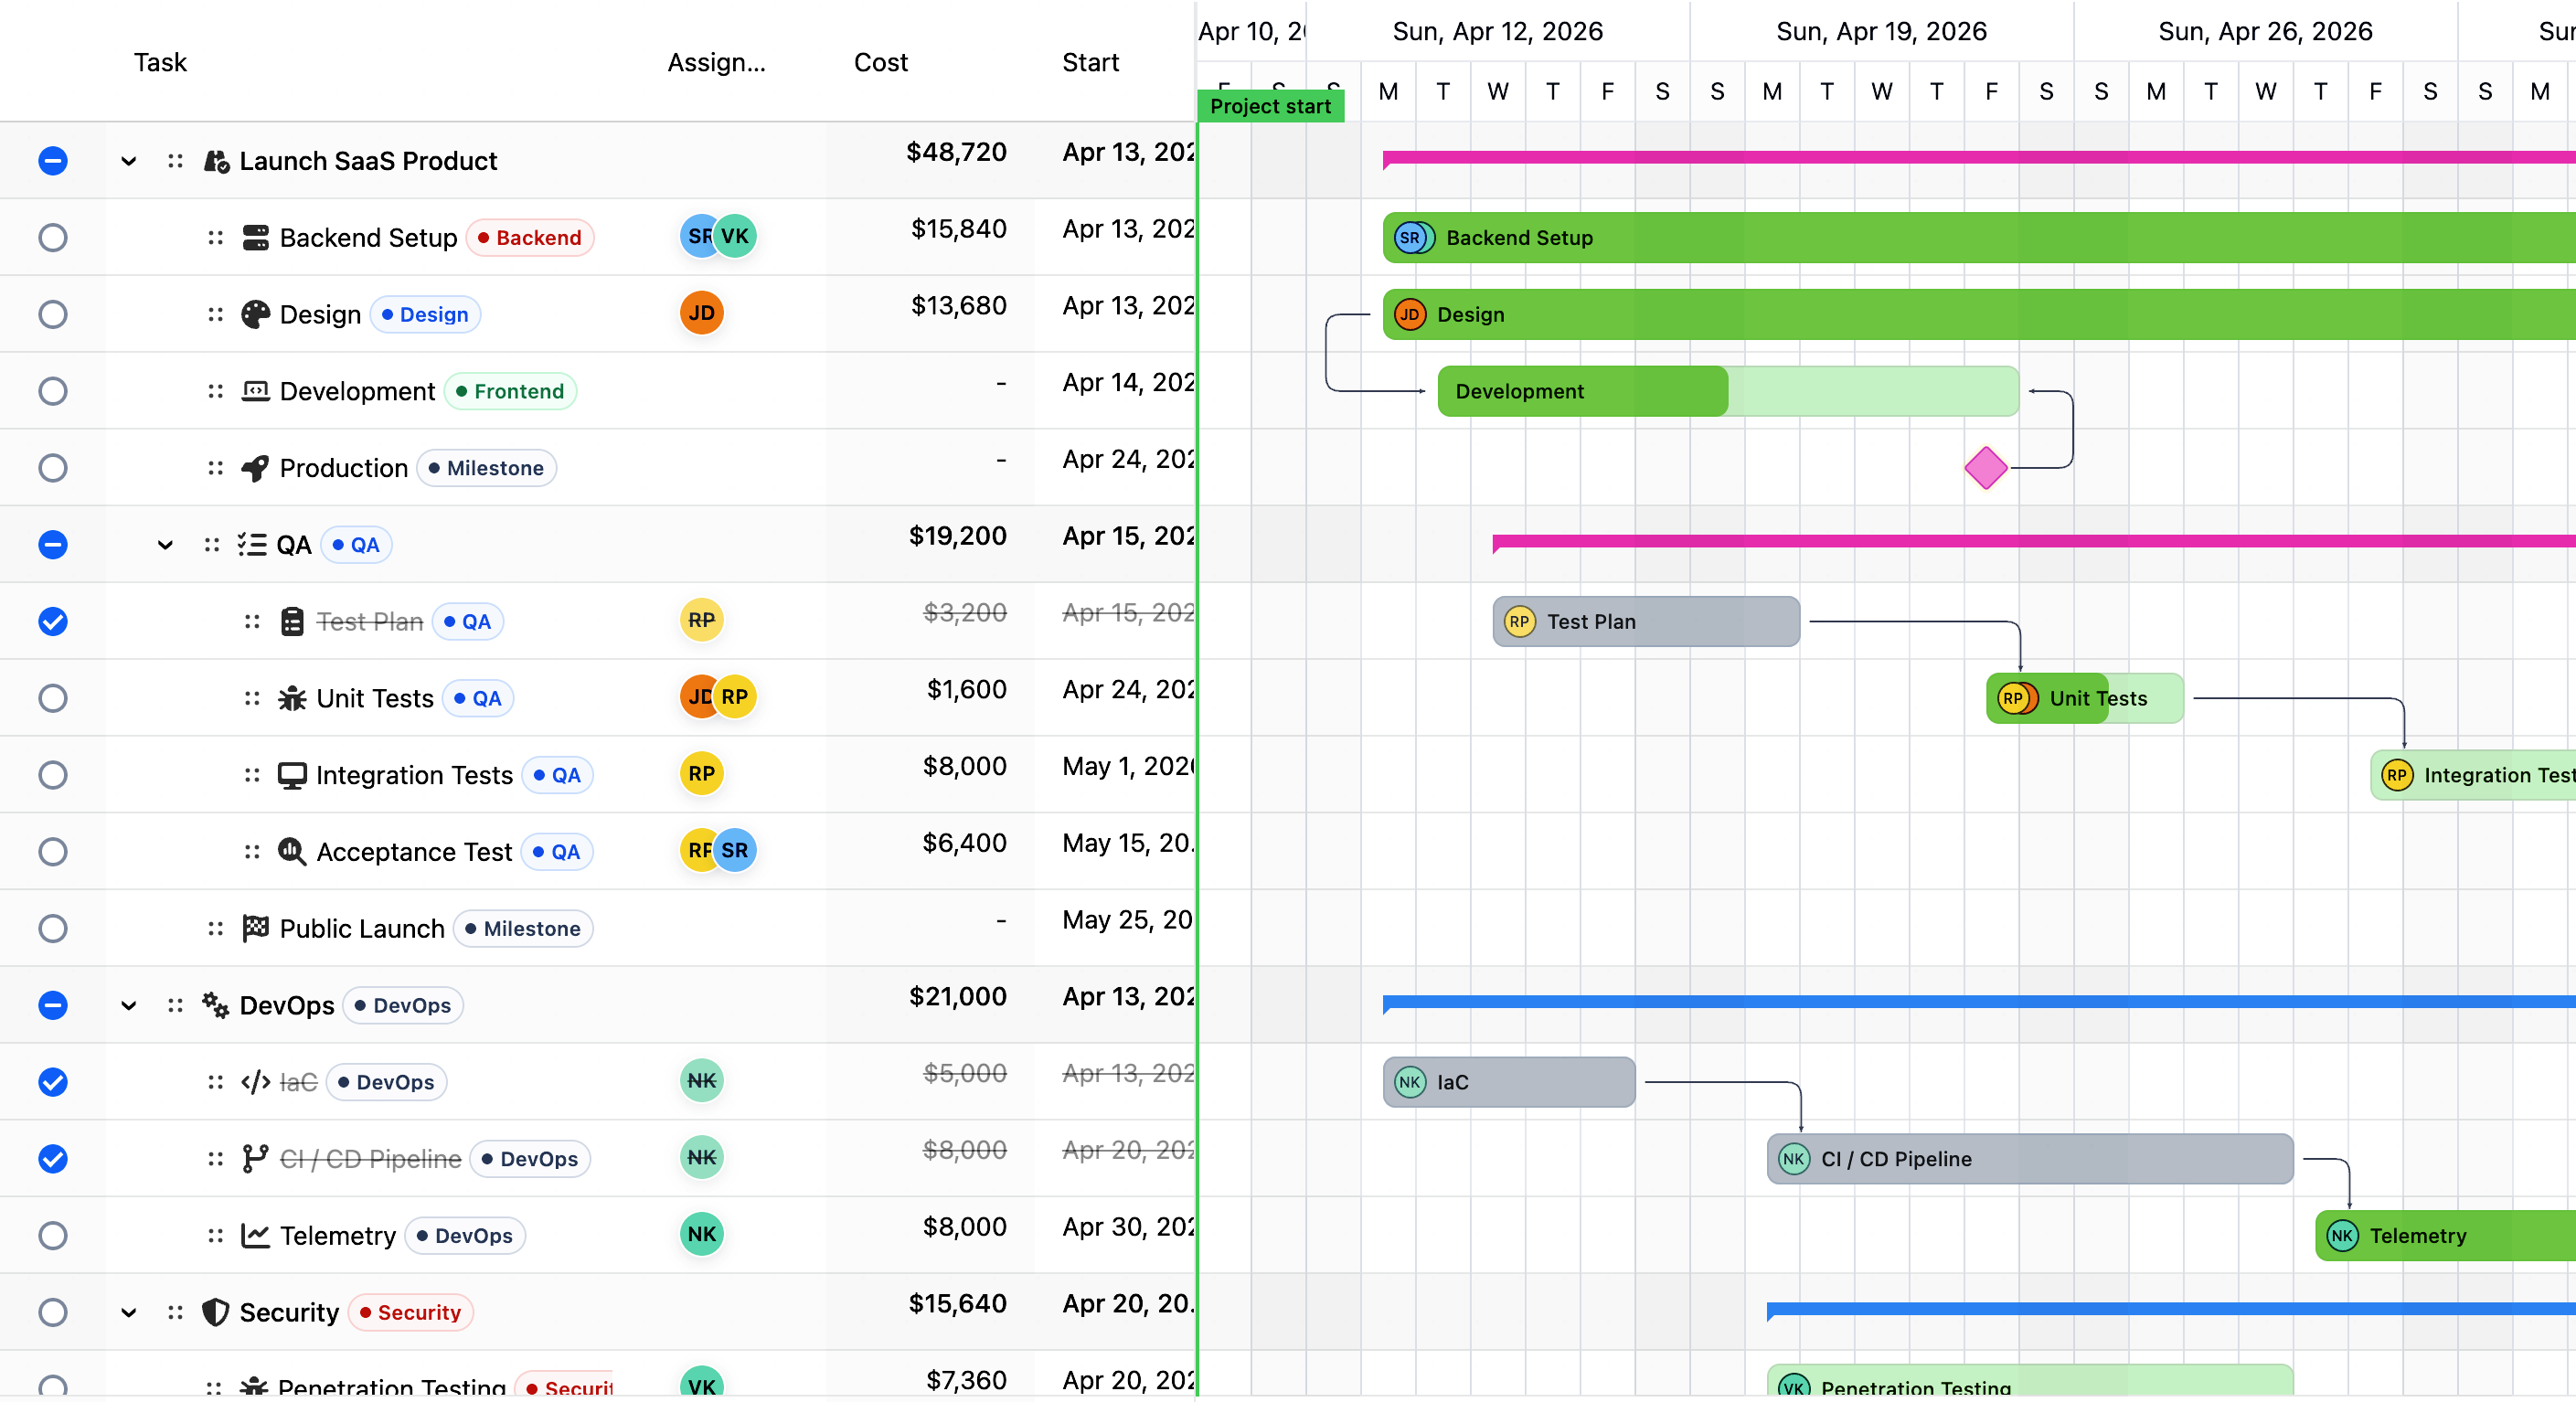
The grid explains the work; the timeline explains time and sequence. Keeping both together reduces the effort required to understand the plan.
One picture creates a better conversation
Lists are good at answering “what exists?” Calendars are good at answering “what happens on this day?” A Gantt chart adds the missing relationships: duration, overlap, sequence, milestones, and the path between today's work and the promised outcome.
That shared picture changes meetings. A customer-success lead can point to a handoff rather than describing it from memory. An operations planner can show why a delivery moved. A developer can see which upstream decision is blocking implementation. People do not need identical domain knowledge to discuss the same plan.
The benefit is not that everyone stares at a chart all day. It is that the team has a common reference when a decision matters.
Risk becomes visible while there is still time to act
Most schedule problems begin quietly. A task takes two days longer. A permit has no owner. A machine is booked twice. A client review lands after the people needed for revisions have moved to another project.
Dependencies, milestones, baselines, critical-path context, and workload signals make those problems easier to see before the final date is missed. The chart does not remove uncertainty, but it makes assumptions discussable:
- Is this handoff truly finish-to-start, or can the next team begin earlier?
- Which milestone has no room left?
- Are we moving work or merely hiding an overload?
- Does the new date still match the customer, supplier, or release commitment?
Early visibility gives people options. Late visibility usually gives them pressure.
Ownership feels clearer without turning the plan into surveillance
A healthy plan answers “who can move this forward?” It should not become a minute-by-minute scorecard of individual activity.
Assignments, status, progress, and editable business fields can give each person enough context to act. A consultant sees the client milestone and remaining work. A site manager sees the inspection that blocks the next crew. A production planner sees the material status beside the operation that needs it.
The human benefit comes from reducing ambiguity, not from adding control. Teams should define ownership at the level needed for coordination and avoid false precision where the work is exploratory.
Handoffs stop living only in people's heads
Many delays happen between tasks, not inside them. The design is complete, but approval is not. A machine is ready, but the material is not. The implementation is finished, but customer training has not been scheduled.
Dependencies make handoffs explicit. Milestones make commitments easy to find. The task grid can keep the business detail—owner, customer, cost code, work order, approval state, or material status—beside the timing relationship.
This is especially valuable when teams cross functions or organizations. The plan becomes a durable piece of shared context instead of knowledge that disappears when someone is unavailable.
Change becomes safer because consequences are easier to explain
Plans change. A Gantt chart is valuable when it helps people explore that change, not when it pretends the original dates were certain.
Dragging a task, changing duration, adjusting a dependency, or comparing against a baseline can turn an abstract request into a visible scenario. The team can see what moved and decide whether the tradeoff is acceptable. History, validation, locked work, or an approval step can protect high-impact changes where the surrounding application requires them.
For consequential schedules, the product should still make authority clear. A visual move is a proposal until the system of record accepts it. Good software explains rejected changes and preserves a reliable way back.
Capacity conversations become more humane
“We are overloaded” is often treated as an individual performance problem when it is really a planning problem. The same person, room, crew, vehicle, or machine may have been promised to overlapping work.
Resource-aware planning moves the discussion from blame to evidence. Teams can inspect assignments, calendars, allocation, and alternatives. They can decide to move work, add capacity, change scope, or accept a later date.
Automatic leveling can be useful, but it should not be mysterious. People need to understand what changed, which constraints were respected, and how the result affects milestones and the critical path. A warning with a clear explanation is often more trustworthy than an unexplained “optimal” plan.
The plan stays connected to real operational data
The strongest reason to embed a Gantt is proximity. ERP users need work-order and material fields. Professional-services teams need budget, role, and client context. Construction teams need crews, suppliers, permits, and inspections. Internal teams may need tickets, owners, environments, or approval states.
When the grid and timeline share one product surface, users do not have to translate those records into a generic project file and then reconcile the result later. The application can keep its own validation, permissions, persistence, and domain actions while adding a visual planning view.
That reduces duplicate entry and the uncertainty of asking, “Which version is current?”
Large plans can remain usable, not merely displayable
Scale is a human concern as much as a technical one. A plan with thousands of tasks is useless if scrolling, editing, or finding the relevant branch breaks the user's train of thought.
RevoGrid Gantt is built on a virtualized grid and timeline, so the browser renders the visible working area rather than every row and time cell at once. Product teams should still test realistic hierarchies, dependencies, custom cells, calculations, and target hardware. Performance claims matter only when the actual planner can move through the schedule without waiting on the interface.
What different people gain
| Person | What the Gantt helps them understand | Better outcome |
|---|---|---|
| Planner or project lead | Sequence, slack, milestones, and schedule impact | Fewer last-minute surprises and clearer tradeoffs |
| Individual contributor | Current priority, ownership, dependencies, and nearby commitments | Less time reconstructing context |
| Operations or finance partner | Status beside cost, order, capacity, or approval fields | Decisions stay connected to governed business data |
| Customer-facing team | Delivery milestones, reviews, and handoffs | More credible expectation-setting |
| Product engineering team | How planning behavior fits the host application | One coherent workflow instead of loosely connected tools |
What a Gantt chart does not solve
A Gantt chart cannot create agreement on priorities, make estimates certain, repair an unhealthy workload, or replace domain-specific optimization. It can expose these issues, but people and policies still decide what to do.
The implementation also needs boundaries:
- define which dates and fields users can edit;
- decide which calculations belong in the browser or backend;
- show validation and scheduling diagnostics in plain language;
- protect locked, approved, or externally governed work;
- keep permissions and persistence in the host application;
- provide undo, rejection, or review for high-impact changes;
- measure with production-shaped data instead of a small showcase.
The goal is not to put every workflow into the Gantt. It is to make the planning moments that matter easier to understand and safer to act on.
Evaluate the experience with your team
Choose one real planning flow and ask the people who perform it to work through a change. Can they find the relevant task? Can they see the blocker? Do they understand why another date moved? Can they tell whether the change was saved? Can they recover if it was wrong?
Then test the technical shape: realistic task volume, hierarchy, dependency density, custom columns, resource assignments, permissions, backend rejection, and the devices users actually have.
Explore the live RevoGrid Gantt demos, review the focused guides for ERP, professional services, construction, manufacturing, resource planning, and internal tools, or get the Pro Advanced trial to evaluate a production-shaped plan.