
Dash DataTable Alternatives: What to Use Before Dash 5.0
Deep technical comparison for product teams
RevoGrid for Dash is a virtualized, editable data grid for teams that need a more capable replacement without leaving Python or rewriting the application in React. Dash DataTable is best understood as the original editable table included with Dash for filtering, sorting, paging, selection, and basic spreadsheet-style workflows.
This comparison is for teams evaluating Dash DataTable against RevoGrid for Python dashboards, analytics applications, internal tools, scientific interfaces, financial screens, operational reporting, and data-heavy Dash applications.
Last reviewed: June 4, 2026. Vendor pricing, license terms, and feature packaging can change. Verify official vendor pages before purchase.
Dash DataTable is being removed from the core API
Plotly's Dash DataTable documentation says the component is deprecated and will be removed from the core Dash API in Dash 5.0. Existing applications do not need a rushed rewrite, but they do need a migration plan before upgrading to Dash 5.
Short answer
Use RevoGrid for Dash when you need a fast, editable, spreadsheet-like grid with an MIT-licensed core. Use Dash AG Grid when following Plotly's recommended replacement matters more than keeping the grid lightweight. Use a plain HTML table only when the data is small and read-only.
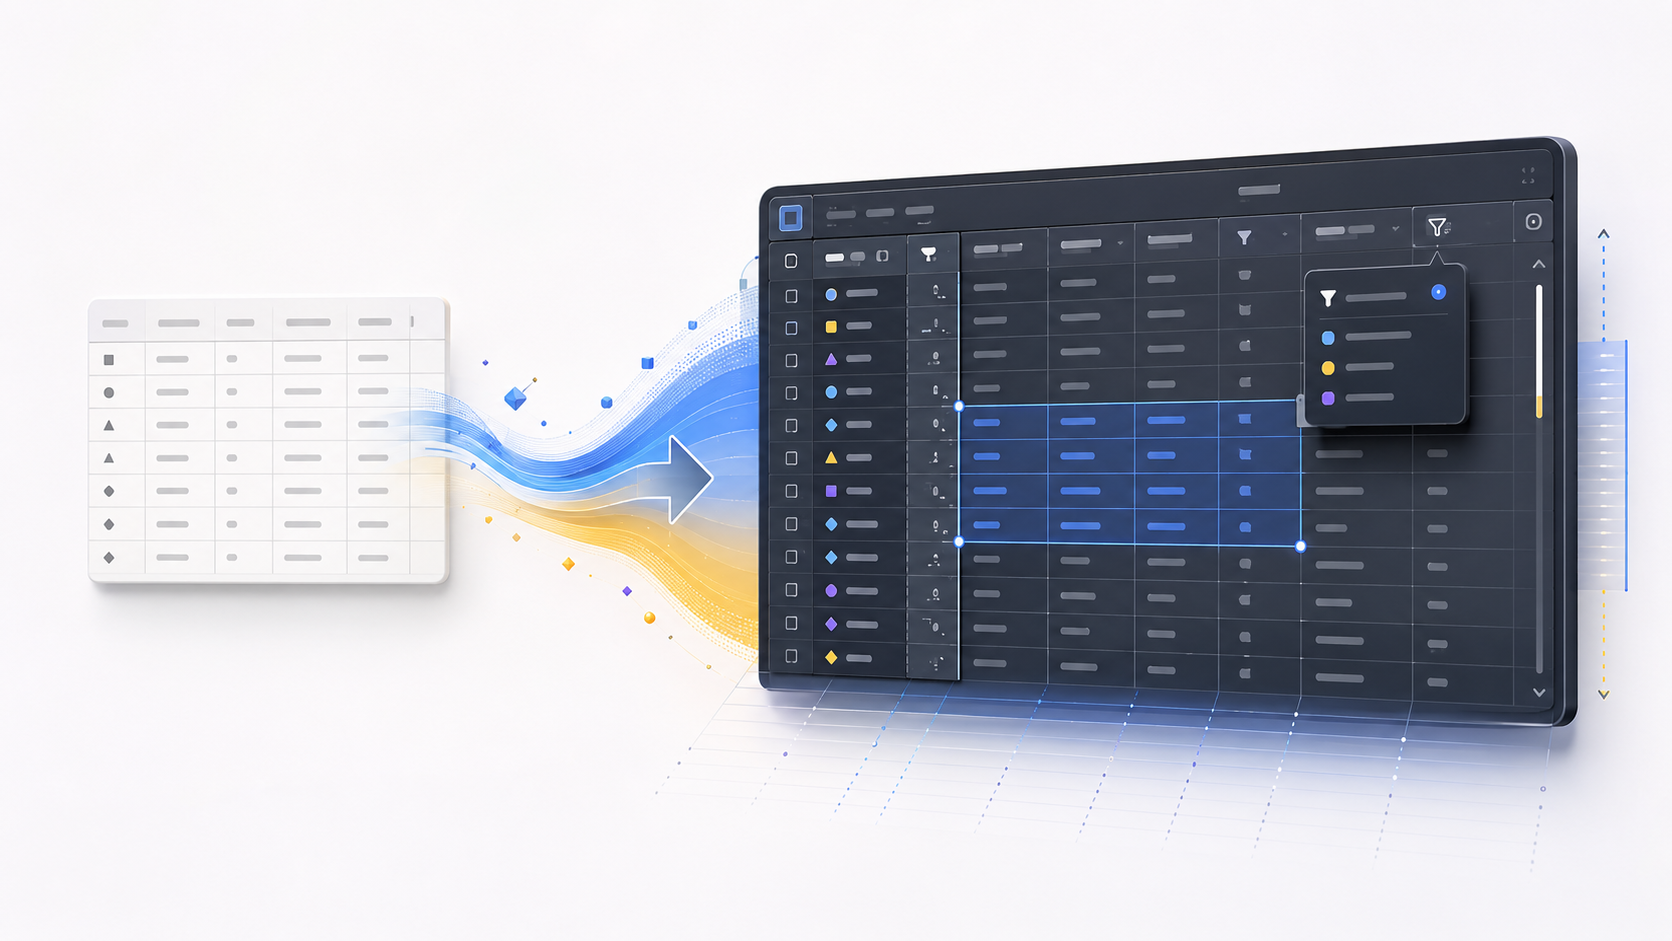
Why replace Dash DataTable now?
Dash DataTable has been useful for years. It puts filtering, sorting, editing, selection, conditional styling, and pagination into a Python-friendly component. For many dashboards, it was the obvious step up from html.Table.
The problem is no longer whether DataTable works today. The problem is what happens the next time you upgrade the rest of your Dash application.
Plotly has announced that DataTable will leave the core Dash API in Dash 5.0. Waiting until the framework upgrade means changing the grid at the same time as a major Dash migration. That makes regressions harder to isolate and gives the team less time to test editing, callbacks, filters, selected rows, and persistence.
A safer sequence is:
- Replace DataTable while the application still runs on Dash 3 or Dash 4.
- Verify the new grid with real data and existing callbacks.
- Upgrade to Dash 5 after the replacement package confirms compatibility.
The current dash-datagrid release declares support for Dash 3.x and 4.x. Check its compatibility notes before taking the separate Dash 5 upgrade step.
The main Dash DataTable alternatives
There is no single replacement for every application. The right choice depends on whether you need an interactive data grid, a broad enterprise grid ecosystem, or simply a readable table.
| Option | Best for | Editing and grid UX | Large datasets | Licensing |
|---|---|---|---|---|
| RevoGrid for Dash | Data-heavy Dash apps, spreadsheet-like editing, virtual scrolling, compact edit callbacks | Strong | Row and column virtualization | MIT-licensed Core |
| Dash AG Grid | Teams following Plotly's recommended path or already using AG Grid | Strong; capabilities depend on Community or Enterprise feature | Strong virtualization | Community features are free; some features require AG Grid Enterprise |
html.Table or a styled table component | Small, mostly read-only results | Minimal unless you build it yourself | Not intended for grid-scale interaction | Depends on the table package |
| Keep DataTable temporarily | Buying a little migration time | Existing behavior only | Existing limitations remain | Short-term compatibility strategy, not a replacement |
1. RevoGrid for Dash
RevoGrid is a good Dash DataTable alternative when the table is an important working surface rather than the final ten rows under a chart.
The official Python package is:
python -m pip install dash-datagridThe component is imported as:
from dash_datagrid import RevoGridIt gives Dash applications a Python interface to RevoGrid Core, including:
- virtualized rows and columns;
- editable cells;
- range selection;
- copy and paste;
- column resizing and movement;
- sorting and built-in filters;
- pinned columns and rows;
- row grouping;
- CSV export behavior;
- Dash callback properties for RevoGrid events.
The Python package includes the browser bundle, so a normal Dash app does not need a separate npm installation.
The most important architectural difference is how edits reach Python. By default, RevoGrid sends a compact afteredit event instead of serializing and returning the complete dataset after every cell change. That is a better fit for large datasets, autosave endpoints, audit logs, and database-backed applications.
2. Dash AG Grid
Plotly recommends Dash AG Grid in the DataTable deprecation notice. It is the natural choice if your team already knows AG Grid, wants to stay close to Plotly's documented migration path, or needs features from the wider AG Grid ecosystem.
It is also important to separate AG Grid Community from AG Grid Enterprise. The Dash wrapper contains both, but Enterprise functionality requires the appropriate commercial AG Grid license. Review the exact features you use before assuming the migration will be entirely free.
Dash AG Grid is a strong product. RevoGrid becomes especially interesting when you want an MIT-licensed, grid-first core; spreadsheet-style interaction; and a smaller conceptual move from a Python DataTable to an editable virtual data grid.
3. A plain HTML or styled table
Not every DataTable needs another data grid.
If the component only shows a short report and users do not edit, filter, select, resize, copy ranges, or navigate thousands of rows, an html.Table or a table from your UI library may be the cleaner replacement.
Do not choose a full grid because the old component happened to be a DataTable. Choose one because the screen actually needs grid behavior.
RevoGrid vs Dash DataTable at a glance
| Decision point | RevoGrid for Dash | Dash DataTable | What it means for migration |
|---|---|---|---|
| Status | ✅ Actively packaged | ⚠️ Deprecated; planned for removal from the core API in Dash 5.0 | RevoGrid provides a maintained destination instead of a temporary compatibility pin. |
| Python package | dash-datagrid | Included through Dash today | Install the replacement independently before upgrading Dash. |
| Python component | dash_datagrid.RevoGrid | dash.dash_table.DataTable | The layout changes at the component boundary; the rest of the Dash app can remain Python. |
| Primary data prop | source | data | Both accept lists of row dictionaries. |
| Column key | prop | id | Rename the field reference in each column definition. |
| Virtualized rows | ✅ | ✅ | Both avoid rendering every record into the DOM at once. |
| Virtualized columns | ✅ | ⚠️ Layout and virtualization constraints | RevoGrid is a better fit for wide operational datasets. |
| Cell editing | ✅ | ✅ | Existing editable workflows can be preserved with new callback wiring. |
| Range selection | ✅ | ⚠️ More limited spreadsheet workflow | RevoGrid offers a more spreadsheet-like working surface. |
| Copy and paste | ✅ | ✅ | Users can continue moving tabular values between the grid and spreadsheets. |
| Range fill | ✅ | ❌ | Users can extend values across a selected range. |
| Column resizing | ✅ | ⚠️ Styling-driven | Resizing is a grid behavior rather than a CSS workaround. |
| Pinned columns | ✅ | ✅ Fixed columns | Map fixed DataTable columns to RevoGrid's pin setting. |
| Sorting and filtering | ✅ | ✅ | Map DataTable actions to sortable columns and typed RevoGrid filters. |
| Row grouping | ✅ | ❌ | Grouped operational views do not require a separate table implementation. |
| Compact cell-edit event | ✅ afteredit | ⚠️ Common patterns pass larger table state | Persist a cell delta without returning every row on each edit. |
| Full edited source synchronization | ✅ Optional | ✅ Common DataTable pattern | Enable it only when an existing callback truly needs the whole source. |
| MIT-licensed core | ✅ | ✅ | Core grid capabilities remain available under a permissive license. |
| Best fit | ✅ Interactive, data-heavy application screens | ⚠️ Existing smaller tables awaiting migration | Choose the replacement according to how users work with the data. |
Where RevoGrid is stronger
1. Virtualized rows and columns
RevoGrid virtualizes both dimensions, keeping the rendered surface focused on the visible viewport. That makes it a strong fit for wide order books, financial records, scientific datasets, and operational screens where users scroll through many fields as well as many records.
2. Spreadsheet-like interaction
Range selection, copy and paste, pinned columns, keyboard navigation, and range fill make the grid a working surface rather than a static report. These interactions matter when users reconcile, classify, correct, or enrich records directly inside a Dash application.
3. Smaller callback payloads for edits
The afteredit event reports the changed cell. Your callback can persist that delta to an API or database without sending the complete table back to Python. Full-source synchronization is still available for applications that need it, but it is an explicit choice rather than the default edit path.
4. A Python-first migration path
RevoGrid for Dash ships its browser bundle with the Python package. Teams can replace the component and adapt callbacks without introducing a separate React application or JavaScript build pipeline.
A minimal DataTable replacement
A typical DataTable may look like this:
from dash import dash_table

dash_table.DataTable(
    id="orders-grid",
    columns=[
        {"name": "Order", "id": "order", "editable": False},
        {"name": "Customer", "id": "customer"},
        {"name": "Amount", "id": "amount", "type": "numeric"},
    ],
    data=rows,
    editable=True,
    filter_action="native",
    sort_action="native",
    page_size=25,
)
The RevoGrid version uses source for rows and prop for the field represented by each column:
from dash_datagrid import RevoGrid

RevoGrid(
    id="orders-grid",
    columns=[
        {
            "prop": "order",
            "name": "Order",
            "readonly": True,
            "size": 130,
        },
        {
            "prop": "customer",
            "name": "Customer",
            "sortable": True,
            "filter": "string",
            "size": 180,
        },
        {
            "prop": "amount",
            "name": "Amount",
            "sortable": True,
            "filter": "number",
        },
    ],
    source=rows,
    rowHeaders=True,
    resize=True,
    range=True,
    useClipboard={"rangeFill": True},
    filter=True,
    style={"height": 420},
)
Notice that the grid has an explicit height. RevoGrid fills its host element, so a missing height is the most common reason for a blank or zero-height grid.
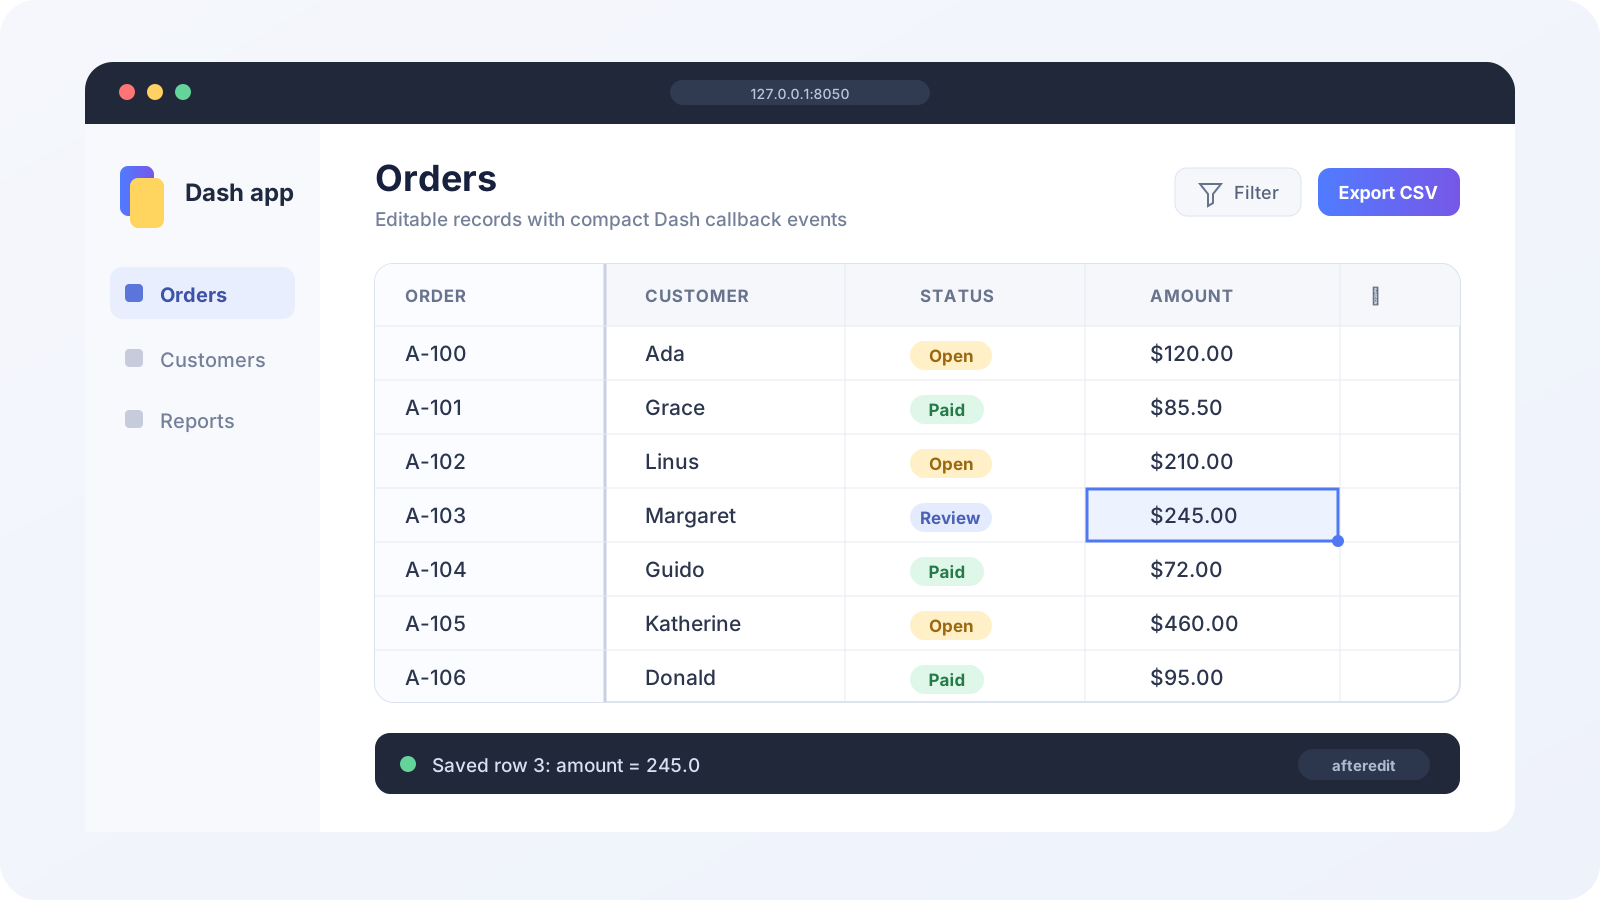
Using a Pandas DataFrame
For a DataFrame containing ordinary strings, finite numbers, booleans, and null-compatible values, convert it to records:
rows = frame.to_dict("records")Real DataFrames often contain timestamps, NumPy values, or missing values that are not directly JSON serializable. In that case, normalize through JSON:
import json

rows = json.loads(
    frame.to_json(
        orient="records",
        date_format="iso",
    )
)
Then pass those rows to source:
grid = RevoGrid(
    columns=[
        {"prop": "date", "name": "Date", "sortable": True},
        {"prop": "product", "name": "Product", "filter": "string"},
        {"prop": "revenue", "name": "Revenue", "filter": "number"},
    ],
    source=rows,
    style={"height": 480},
)
Handling edited cells with a Dash callback
DataTable applications often listen to the complete data property or compare it with data_previous. That works for small tables, but it becomes wasteful as the dataset grows.
RevoGrid's default is a compact edit delta:
from dash import Input, Output, callback


@callback(
    Output("save-status", "children"),
    Input("orders-grid", "afteredit"),
    prevent_initial_call=True,
)
def save_edit(event):
    detail = event["detail"]

    if "prop" not in detail:
        return "A range edit was received"

    row_index = detail["rowIndex"]
    field = detail["prop"]
    value = detail["val"]

    # Persist the change to your API or database here.
    return f"Saved row {row_index}: {field} = {value!r}"
For database-backed data, include a stable ID in every row. The event reports the visible row index, which you can map back to the row's identifier before saving.
If a callback truly needs the complete updated dataset, enable source synchronization:
RevoGrid(
    id="orders-grid",
    columns=columns,
    source=rows,
    syncSourceOnEdit=True,
    style={"height": 420},
)
You can then listen to source, but the browser must snapshot and transmit the full dataset after each edit. Leave syncSourceOnEdit=False for large tables unless full synchronization is genuinely required.
Complete runnable example
Install the packages:
python -m pip install "dash>=3,<5" dash-datagrid pandasSave this as app.py:
import json

import pandas as pd
from dash import Dash, Input, Output, callback, html
from dash_datagrid import RevoGrid


frame = pd.DataFrame(
    [
        {
            "order": "A-100",
            "customer": "Ada",
            "status": "Open",
            "amount": 120.0,
        },
        {
            "order": "A-101",
            "customer": "Grace",
            "status": "Paid",
            "amount": 85.5,
        },
        {
            "order": "A-102",
            "customer": "Linus",
            "status": "Open",
            "amount": 210.0,
        },
    ]
)

rows = json.loads(frame.to_json(orient="records", date_format="iso"))

columns = [
    {
        "prop": "order",
        "name": "Order",
        "readonly": True,
        "pin": "colPinStart",
        "size": 120,
    },
    {
        "prop": "customer",
        "name": "Customer",
        "sortable": True,
        "filter": "string",
        "size": 180,
    },
    {
        "prop": "status",
        "name": "Status",
        "sortable": True,
        "filter": "string",
        "size": 120,
    },
    {
        "prop": "amount",
        "name": "Amount",
        "sortable": True,
        "filter": "number",
        "size": 120,
    },
]

app = Dash(__name__)

app.layout = html.Main(
    [
        html.H1("Orders"),
        html.P(
            "Edit a customer, status, or amount. "
            "The callback receives a compact cell-change event."
        ),
        RevoGrid(
            id="orders-grid",
            columns=columns,
            source=rows,
            rowHeaders=True,
            resize=True,
            range=True,
            useClipboard={"rangeFill": True},
            filter=True,
            style={"height": 420},
        ),
        html.Pre("No edits yet.", id="edit-output"),
    ],
    style={"maxWidth": 960, "margin": "40px auto", "padding": "0 20px"},
)


@callback(
    Output("edit-output", "children"),
    Input("orders-grid", "afteredit"),
    prevent_initial_call=True,
)
def show_edit(event):
    detail = event["detail"]

    if "prop" not in detail:
        return f"Range edit: {detail}"

    return (
        f'Row {detail["rowIndex"]}, field {detail["prop"]} '
        f'changed to {detail["val"]!r}'
    )


if __name__ == "__main__":
    app.run(debug=True)
Run it:
python app.pyOpen the local address printed by Dash, normally http://127.0.0.1:8050.
Dash DataTable to RevoGrid migration map
The APIs are similar in purpose but not identical. Treat the migration as a small component rewrite, not a search-and-replace operation.
| Dash DataTable | RevoGrid for Dash | Migration note |
|---|---|---|
data | source | Both accept row records |
Column id | Column prop | The key used to read the value from a row |
Column editable=False | Column readonly=True | The boolean direction is reversed |
editable=True | readonly=False or omit it | RevoGrid cells are editable unless locked |
filter_action="native" | filter=True plus column filter types | Use "string" or "number" on relevant columns |
sort_action="native" | Column sortable=True | Sorting is enabled per column |
fixed_columns | Column pin: "colPinStart" | Pin the columns that must remain visible |
style_table={"height": ...} | Component style={"height": ...} | Give the RevoGrid host an explicit height |
data / data_previous callback | afteredit callback | Prefer compact edit events |
Full edited data state | syncSourceOnEdit=True | Available when the full source is truly needed |
derived_virtual_data | Filter/sort events or app-managed data state | Usually requires a small callback redesign |
What not to migrate blindly
Conditional styling
DataTable's style_data_conditional does not have a one-line Python equivalent for every rule. RevoGrid supports themes, row classes, column settings, and JavaScript render customization, but function-valued cell renderers and style callbacks cannot simply cross the Python-to-browser boundary.
List your current conditional rules and decide which belong in:
- normal column configuration;
- row data and CSS classes;
- a RevoGrid theme;
- a browser-side custom renderer;
- a server-side data transformation.
Pagination
DataTable examples frequently use pagination because rendering the full table is expensive. RevoGrid is virtualized, so client-side paging is not required merely to keep the DOM small.
That does not mean loading every database row into the browser is always a good idea. For very large or remote datasets, keep server-side loading and data ownership in your application architecture. Virtual rendering reduces DOM work; it does not make network transfer or browser memory free.
before* events
RevoGrid exposes event notifications to Dash, but Python callbacks run after a server round trip. They cannot synchronously call preventDefault() inside the browser. Use JavaScript when an operation must be canceled before it happens.
Custom JavaScript functions
The Python component accepts JSON-safe properties. Function-valued custom editors, renderers, comparators, parsers, and filters require browser-side JavaScript and are outside the direct Python property boundary.
A practical migration checklist
Before changing code, inventory how each DataTable is actually used:
- Is it read-only or editable?
- Which callbacks consume
data,data_previous, selected rows, or derived data? - Are filters and sorting client-side or server-side?
- Does the app depend on pagination?
- Are fixed columns or fixed headers important?
- Does the table use conditional styling, Markdown cells, dropdowns, or custom validation?
- How many rows and columns appear in production, not only in the demo dataset?
Then migrate one representative screen first. Choose the table with real editing and callbacks, but avoid the most business-critical screen as the first experiment.
Test:
- Initial data loading.
- Sorting and every filter type.
- Single-cell and range edits.
- Copy and paste from Excel or Google Sheets.
- Pinned columns and horizontal scrolling.
- Callback payloads and database persistence.
- Empty, null, numeric, and date values.
- The largest realistic dataset.
- Keyboard navigation and accessibility.
- Light and dark application themes.
When RevoGrid is the better choice
Choose RevoGrid for Dash when:
- users work directly in the grid rather than only read it;
- the dataset is large or wide;
- smooth virtual scrolling matters;
- users need range selection, copy/paste, or range fill;
- you want compact edit callbacks instead of sending the full dataset;
- an MIT-licensed core is important;
- the grid is central to the product experience.
Choose Dash AG Grid when:
- you want Plotly's recommended DataTable migration path;
- your team already uses AG Grid elsewhere;
- you need a specific AG Grid feature and have verified its Community or Enterprise availability;
- your organization prefers the AG Grid ecosystem and documentation.
Choose a plain table when:
- the output is small and read-only;
- users do not need filtering, sorting, editing, selection, or clipboard workflows;
- accessibility and simple HTML rendering matter more than grid behavior.
FAQ
Is Dash DataTable deprecated?
Yes. Plotly's official documentation says Dash DataTable is deprecated and will be removed from the core Dash API in Dash 5.0.
Will my DataTable app stop working immediately?
No. An existing environment does not change by itself. You can temporarily pin Dash to a compatible version, but you should replace DataTable before upgrading to Dash 5.
What is the best Dash DataTable alternative?
For a high-performance, editable Python Dash data grid, RevoGrid is a strong option. Dash AG Grid is also a strong choice, especially when you want Plotly's recommended migration path. For a small read-only result, use a normal table instead of either grid.
Is RevoGrid for Dash open source?
The dash-datagrid package and RevoGrid Core use the MIT license. RevoGrid also has separate commercial modules for advanced product workflows, but the official Python package described here wraps the Core grid.
Can RevoGrid use a Pandas DataFrame?
Yes. Convert the DataFrame with frame.to_dict("records"), or use frame.to_json(orient="records") followed by json.loads() when you need to normalize timestamps, NumPy values, and missing data.
Can a Dash callback receive cell edits?
Yes. Listen to the grid's afteredit property. It contains a JSON-safe event envelope with the row index, column index, field name, and new value for a single-cell edit.
Does RevoGrid support Dash 5.0?
The current package release declares Dash 3.x and 4.x compatibility. Migrate the grid first, and upgrade to Dash 5 only after the package's compatibility range is updated and your application has been tested.
Final recommendation
Do not wait for the Dash 5 upgrade to discover how deeply DataTable is connected to your callbacks.
If the table is small and read-only, simplify it. If your organization already relies on AG Grid, evaluate Dash AG Grid. If you need a fast, editable, virtualized Dash data grid with spreadsheet-like interaction and an MIT-licensed core, start with RevoGrid for Dash.
The migration is straightforward for ordinary row data and columns. The main work is reviewing callbacks and deciding whether each edit should send a compact delta or a complete source snapshot. Making that decision now gives you time to test the behavior properly—before the framework upgrade adds another moving part.
Replace Dash DataTable with a virtualized Python data grid.
Read the Dash Data Grid guide · View the Python package on GitHub · Explore RevoGrid
Dash, Plotly, Dash DataTable, AG Grid, Excel, and Google Sheets are trademarks of their respective owners. This page is an independent migration guide for developers evaluating data-grid components.