
RevoGrid Gantt browser benchmark
10,000 editable tasks and 19,796 dependencies in a live browser demo
This is a reproducible Gantt benchmark, not a claim that RevoGrid is universally the fastest. It measures the same deterministic workload repeatedly on one documented browser and machine, publishes every raw sample, and reports the median of five measured runs after one discarded warm-up.
Open the interactive benchmark · Raw JSON · Raw CSV · Dataset generator · Playwright runner
Dataset matrix
The reference run covers 100, 1,000, 5,000, and 10,000 total task rows at three deterministic dependency densities:
| Density | Target relationship count | Construction |
|---|---|---|
| Sparse | 0.5 × task count | Forward-only leaf relationships |
| Normal | 1.9796 × task count | The 10,000-task case contains exactly 19,796 relationships |
| High | 4 × task count | Multiple unique forward relationships per leaf task |
Every project uses deterministic 25-row hierarchy groups. Dependencies connect leaf tasks only, remain unique and acyclic, and use stable IDs. Initial load, vertical navigation, editing, dependency, hierarchy, memory, and DOM cases use a three-month timeline; horizontal navigation uses the same case matrix across twenty years.
Measurement definitions
- Interactive: the grid has fired
aftergridrender, the Gantt plugin snapshot contains the exact task and dependency counts, the timeline viewport exists, a leaf task bar is mounted and hit-testable, and two animation frames have completed. - Navigation: scripted viewport traversal records frame intervals, raw FPS, a 60 Hz-capped value, frames over 20 ms, and browser long tasks over 50 ms.
- Move and resize: Playwright drives the real pointer interaction. Results separate pointer-down-to-preview from pointer-up-to-committed-paint latency.
- Dependency update: one public dependency-collection replacement is timed through recalculated snapshot and painted schedule.
- Hierarchy: public Tree plugin collapse/expand operations are timed through projected and painted rows.
- Memory: Chromium heap is sampled five times after initial readiness and after the scripted interaction loop, with garbage collection requested through the DevTools protocol.
- DOM footprint: mounted row elements, unique logical rows, cells, task bars, dependency elements, and all page nodes are retained in the raw results.
Each case/scenario/run opens an isolated browser page. Dataset generation and navigation-to-interactive are published separately from source-apply-to-interactive so fixture construction and module loading are not hidden inside the chart-render number.
Run it locally
pnpm benchmark:smoke
pnpm benchmark:run
pnpm benchmark:results
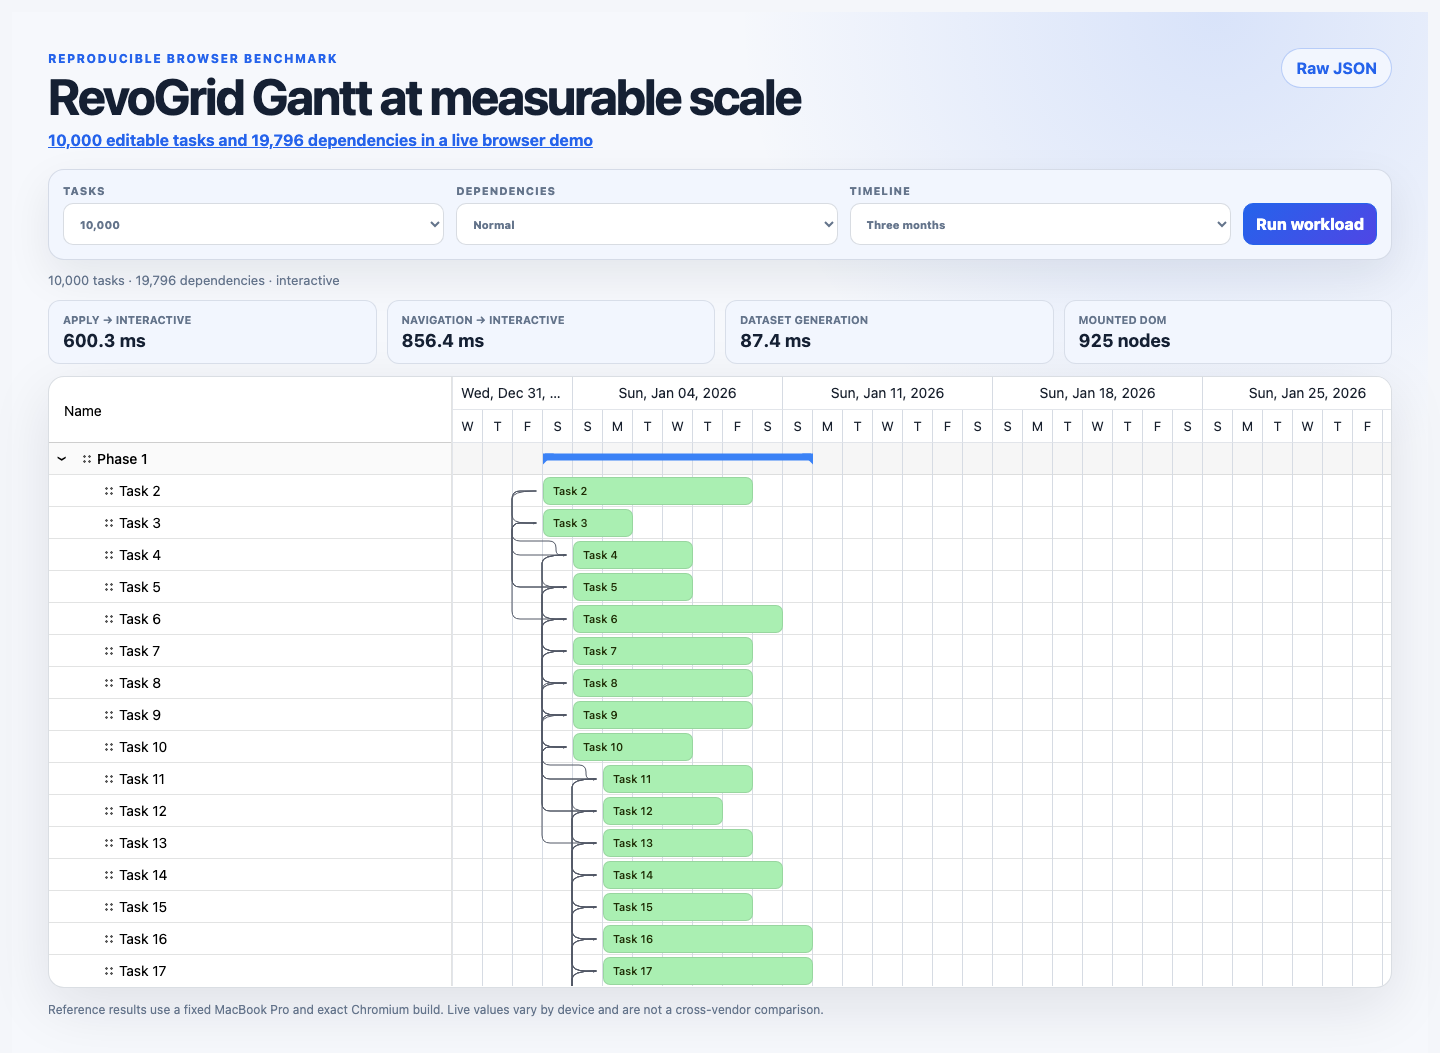
Run these commands from the standalone Gantt repository. The full command records one warm-up and five measured runs for all twelve cases and writes date-stamped plus stable JSON/CSV, a reference screenshot, and a walkthrough video under benchmarks/results/.
Reference image and video
Known limitations
- Results describe the documented machine and exact Chromium build, not every user device.
- The reference harness uses Vanilla TypeScript; React, Vue, and Angular wrapper overhead is excluded.
- Chromium heap values cover the complete page and are not RevoGrid-only allocations.
- Headless Chromium frame pacing differs from a physical display, so both raw and 60 Hz-capped FPS are retained.
- The deterministic projects are synthetic and local. Network, backend persistence, mobile hardware, custom application renderers, and vendor products are not included.
- Interaction recalculation measurements include the associated browser render. The separate Enterprise scheduler microbenchmark isolates the scheduling engine.
Comparison policy
Do not compare these values directly with a vendor’s published number unless the browser, machine, task/dependency graph, hierarchy, timeline, renderers, virtualization settings, readiness definition, and interaction script are all normalized. Use this repository’s harness unchanged for an apples-to-apples comparison.